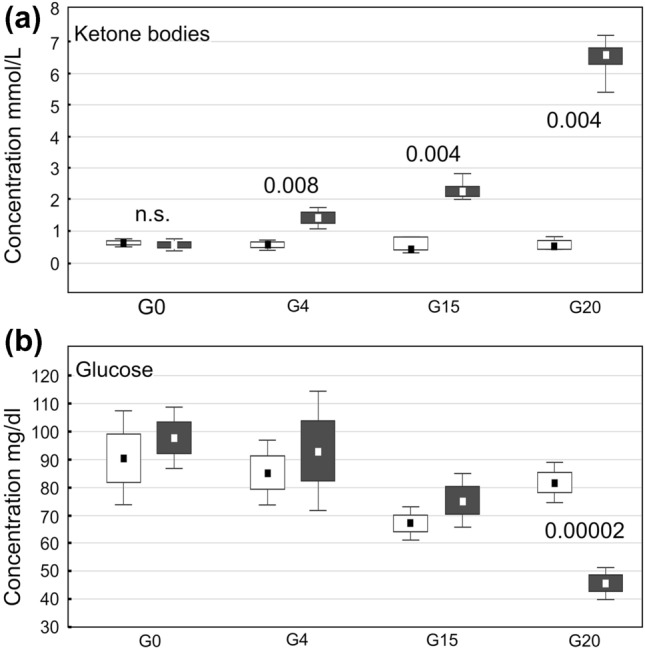
Fig. 5.

Blood levels of ketone bodies (a) and of glucose (b) measured on gestational days 0, 4, 15 and 20 (G0, G4, G15 and G20, respectively) in ND- and KD-fed females (white and black boxes, respectively). The results are shown as medians with Q25, Q75, minima and maxima (small squares, boxes and whiskers, respectively). Decimal indexes show statistical significance of differences between adjacent graphs (nonparametric Mann–Whitney U test)
