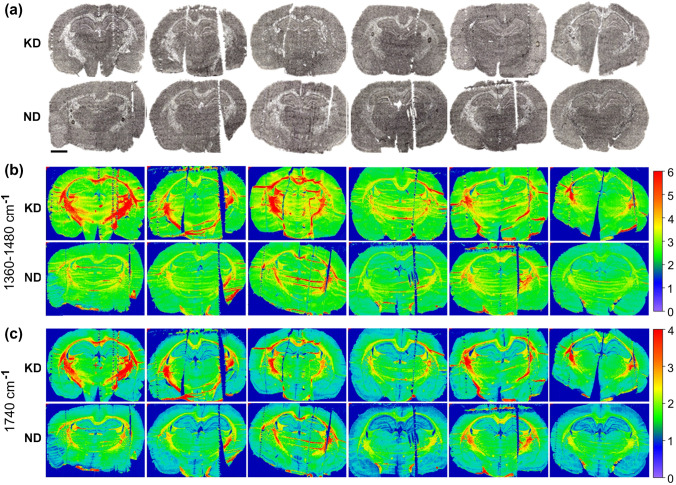
Fig. 6.
Anatomical images and chemical maps of brains
taken from female rats fed with ketogenic (KD) and normal diet (ND): amicroscopic views of unstained brains sections corresponding to chemical maps showing results of FTIR analysis and presented in parts b and c of the figure; b and c the chemical maps showing the distribution of intensity of the 1360–1480 cm −1 massif and 1740 cm−1 band, respectively. Color scales on the right represent the range of changes in the particular band/massif intensity. The bar shows 2.5 mm

