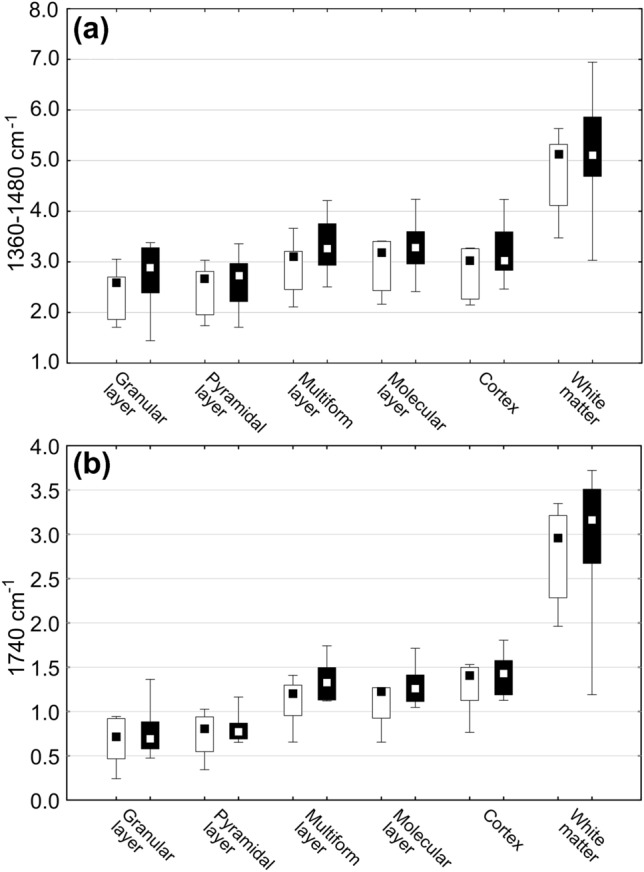
Fig. 8.

The spread of the absolute intensity of 1360–1480 cm−1 (a) and 1740 cm−1 (b) absorption bands recorded within the granular, pyramidal, multiform and molecular layers of the hippocampal formation and the cerebral cortex a underlying white matter. The regions are indicated under the abscissa. Medians, interquartile spans and minimal–maximal values are marked as little square, boxes and whiskers, respectively. No statistically significant differences were detected (nonparametric Mann–Whitney U test). White and black boxes represent groups of ND- and KD-fed females, respectively
