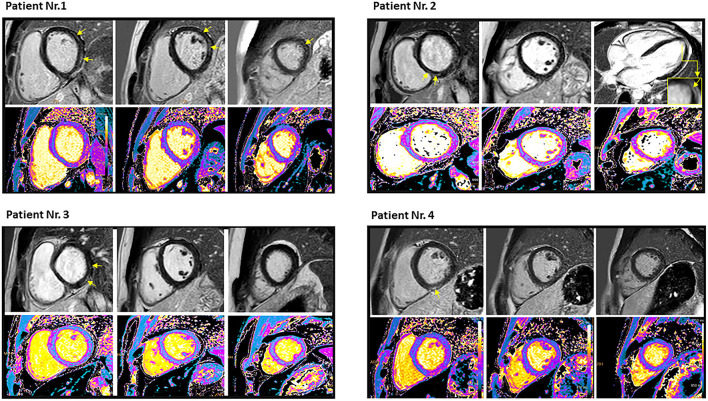
Figure 1.
Cardiac magnetic resonance imaging of the four patients who had myocarditis following the third dose of mRNA COVID-19 vaccination demonstrated late gadolinium enhancement (yellow arrows) and T1 mapping (lower row). Patient no. 1: Mid wall late gadolinium enhancement involving 9% of the myocardium with corresponding myocardial injury in native T1 mapping imaging in antero- and infero-lateral segments of basal and mid ventricular short-axis view, as well as in the lateral segment of apical short-axis view. Native T1 value was 1,135 ms, and T2 value was 69.2 ms. Peak troponin was 240 ng/L, and scan delay (from COVID-19 vaccine) was 8 days. Patient no. 2: Mid wall late gadolinium enhancement involving 1% of the myocardium with corresponding myocardial injury in native T1 mapping imaging in the lateral segment of apical and in the septal segment of the basal short-axis view. Native T1 value was 1,077 ms, and T2 value was 57.5 ms. Peak troponin was 80 ng/L, and scan delay (from COVID-19 vaccine) was 40 days. Patient no. 3: Epicardial late gadolinium enhancement involving 3% of the myocardium with corresponding myocardial injury in native T1 mapping imaging in the inferior and inferolateral segments of the basal short-axis view. Native T1 value was 1,155 ms, and T2 value was 58.1 ms. Peak troponin T was 4,967 ng/L, and scan delay (from COVID-19 vaccine) was 47 days. Patient no. 4: Mid wall late gadolinium enhancement involving 1% of the myocardium with corresponding myocardial injury in native T1 mapping imaging in inferior segments of the basal and mid-ventricular short axis view, as well as in the lateral segment of the apical short axis view. Native T1 value was 1,041 ms, and T2 value was 57.4 ms. Peak troponin T was79 ng/L, and scan delay (from COVID-19 vaccine) was 42 days. Reference (normal) values: T1: 950–1,060 ms, T2: < 57 ms, and troponin T < 13 ng/L.

