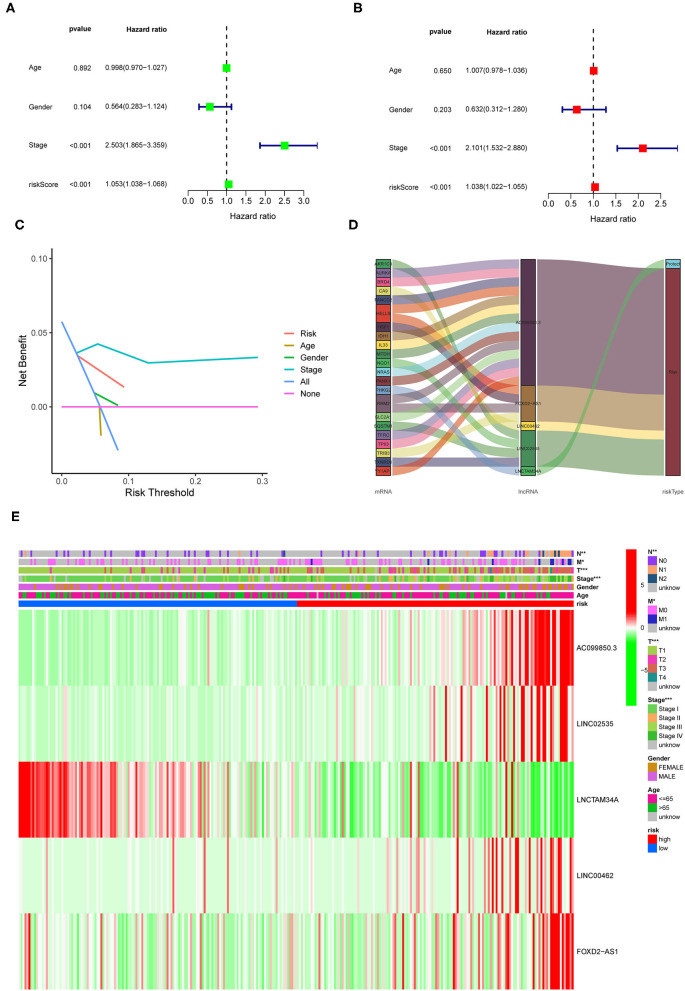
Figure 4.
Prognostic value of the identified signature in pRCC. (A,B) Univariate and multivariate COX regression analyses for the expression levels of ferroptosis-related lncRNAs. (C) The decision curve analysis (DCA) results for the risk factors. (D) Sankey diagram showing the relationship between the identified lncRNAs and mRNAs. (E) A heatmap for the identified ferroptosis-related lncRNAs in the prognostic risk model, along with the clinicopathological features.

