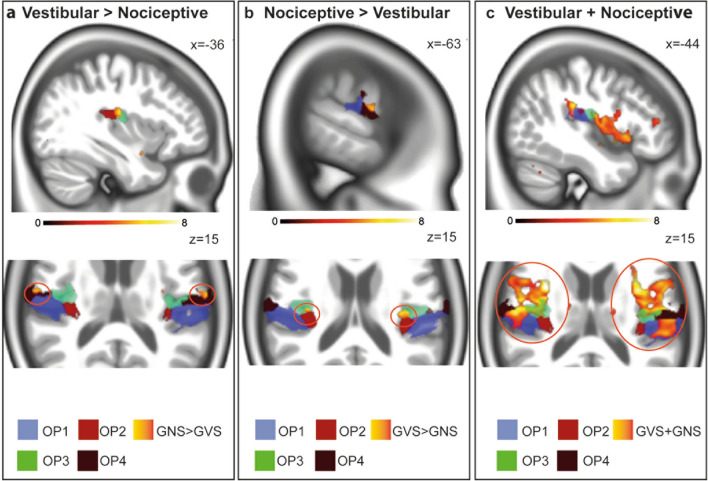
Fig. 2.
Responses in the parietal operculum during the different tasks. Nociceptive stimulation (yellow-orange) revealed stronger response in OP3 (green), as well as OP1 and OP4 (a) when contrasted with GVS. Vestibular stimulation (yellow-orange) gave signal increases in a cluster adjacent to OP4 (black) and adjacent to OP3 (not shown) compared to nociceptive stimulation (b). The conjunction analysis (yellow-orange, c) revealed common responses in area OP 1 (blue), OP3 (green) and OP4 black. Note that no conjunct activation of area OP2 was found. All activation maps were thresholded at p < 0.05, FDR TFCE

