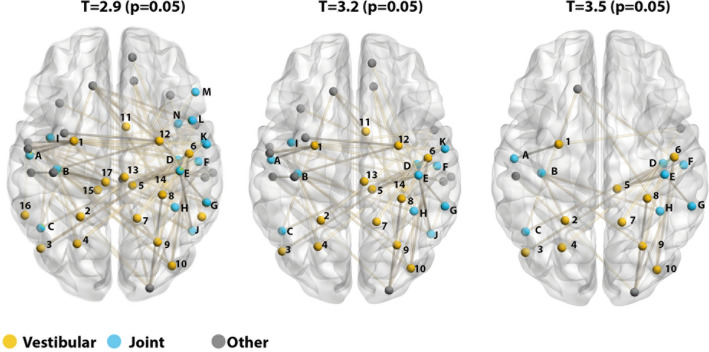
Fig. 4.
Significant components for three incremental primary thresholds of the contrast GNS > GVS. The results of the three thresholds are presented in incrementing order (left: T = 2.9; middle: T = 3.2; right: T = 3.5). Nodes were coloured according to the findings of the task-based analysis: yellow nodes were located in areas uniquely activated during GVS, blue nodes were located within regions jointly activated by GVS and GSN and grey nodes were located in other regions. Labels are shortened according to Schaefer et al. (2017) (legend is provided in supplemental Table 2)

