Figure 5.

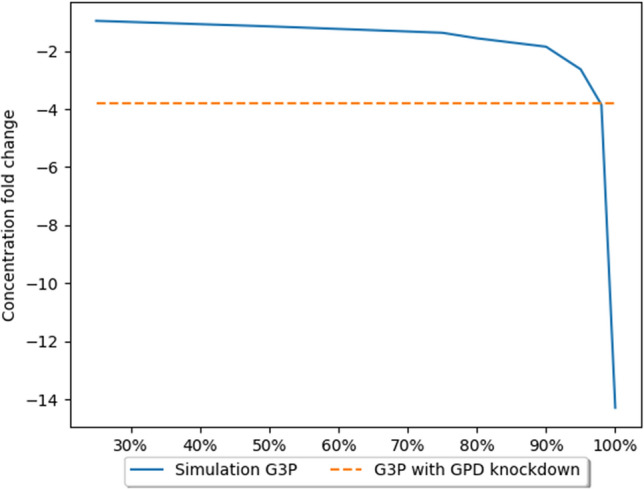
The effects of GPD gene expression knockdown on G3P concentration26. The X axis presents level of simulated GPD inhibition. The Y axis presents fold change in concentration in comparison to the natural state (without inhibition).

The effects of GPD gene expression knockdown on G3P concentration26. The X axis presents level of simulated GPD inhibition. The Y axis presents fold change in concentration in comparison to the natural state (without inhibition).