
Figure 5.
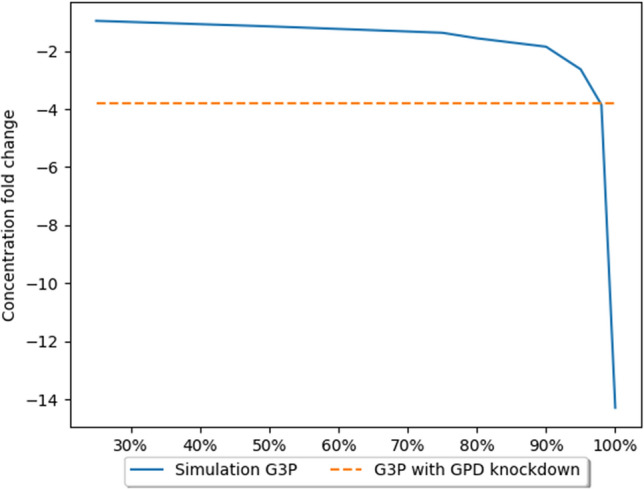
The effects of GPD gene expression knockdown on G3P concentration26. The X axis presents level of simulated GPD inhibition. The Y axis presents fold change in concentration in comparison to the natural state (without inhibition).
Official websites use .gov
A
.gov website belongs to an official
government organization in the United States.
Secure .gov websites use HTTPS
A lock (
) or https:// means you've safely
connected to the .gov website. Share sensitive
information only on official, secure websites.
The effects of GPD gene expression knockdown on G3P concentration26. The X axis presents level of simulated GPD inhibition. The Y axis presents fold change in concentration in comparison to the natural state (without inhibition).