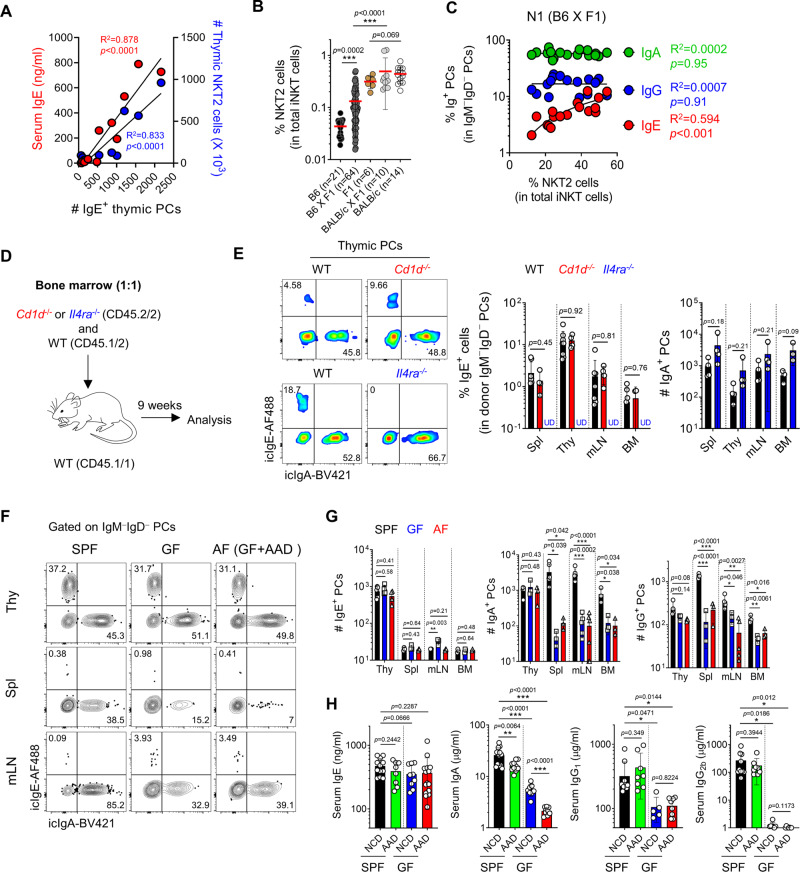
Fig. 2. iNKT cells regulate the development of IgE+ thymic PCs.
A A total of 1–8-week-old BALB/c mice were analyzed for their serum IgE concentrations by ELISA and the numbers of thymic NKT2 and IgE+ PCs. Graph shows their correlations. B Graph shows frequencies of NKT2 cells among total iNKT cells in indicated mice. C Graph shows a correlation between frequencies of thymic NKT2 cells and PCs (N = 17) from F1 X B6 mice. D Schematic of an experimental strategy of mixed BM chimera. E Total thymocytes from BM chimera generated as in (D) were enriched for CD138+ cells by MACS. Representative plots show IgE+ thymic PCs derived from WT and Cd1d−/− (upper) or Il4ra−/− (lower) donors. Graph shows statistical analysis (N = 4–8). F–H SPF or GF BALB/c mice were fed with either NCD or AAD and analyzed for thymic PC development (N = 3–6). Representative FACS plots show icIgE, and icIgA expression of PCs in indicated tissues (F), and graphs show statistical analysis (G). Serum IgE, IgA, IgG1, IgG2b concentrations of indicated BALB/c mice were measured by ELISA (N = 8–15) (H). Results are from two independent experiments. Numbers indicate the frequencies of cells in each quadrant. Data are presented as mean values ± SD (B, E, G, and H). Each dot represents an individual mouse. Unpaired two-tailed t-tests were used. ***p < 0.001, **p < 0.01, *p < 0.05. Not significant (p > 0.05). Linear regression was used to calculate goodness of fit (R2) and P values. PC Plasma cell; SPF Specific pathogen-free; GF Germ-free; AF Antigen-free; Thy Thymus; Spl Spleen; mLN Mesenteric lymph node; BM Bone marrow; NCD Normal chow diet; AAD Amino-acid diet; U.D. Undetected.

