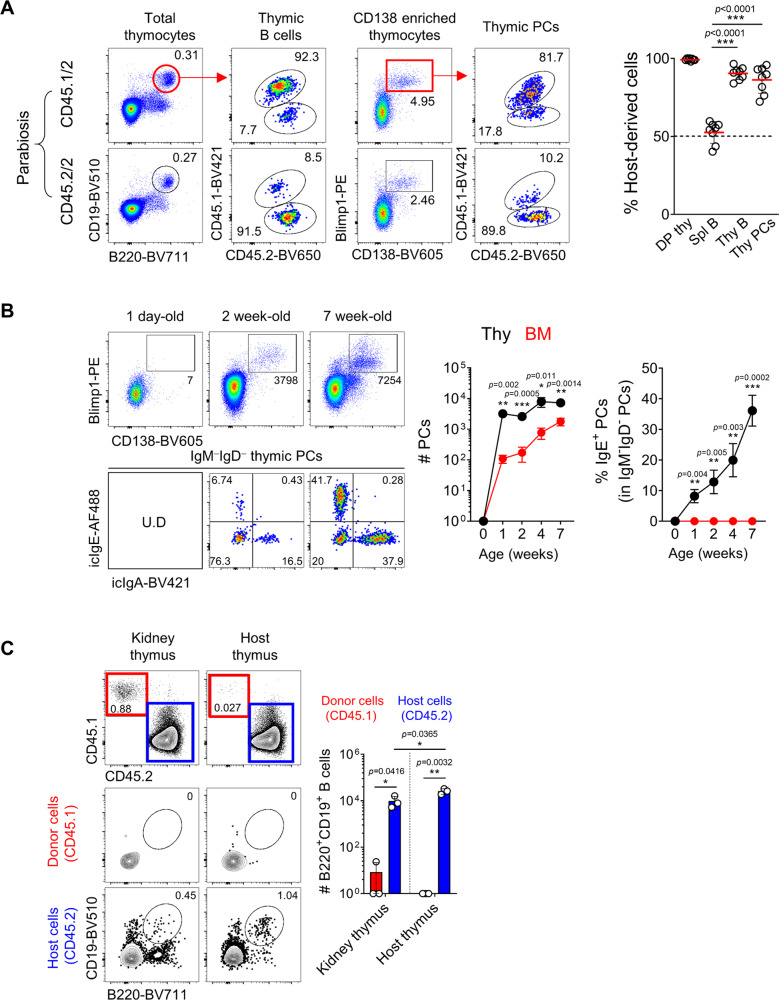
Fig. 3. Thymic PCs are BM-derived tissue-resident cells.
A Congenic pairs of CD45.1/2 and CD45.2/2 mice underwent parabiosis surgery and were analyzed after 2 weeks. Representative dot plots show chimeric ratios of B220+CD19+ B cells from total thymocytes or PCs enriched with CD138 antibody using MACS in the thymus (N = 8). Graph shows statistical analysis of host-derived cells in each parabiont. Numbers indicate frequencies of cells in adjacent gates. B Total thymocytes from mice of indicated ages were enriched for CD138+ PCs by MACS, and representative dot plots are shown after gating out TCRβ+ cells. Numbers indicate total cell numbers in adjacent gates (top) or frequencies of cells in each quadrant (bottom). Graph shows a statistical analysis of the total numbers of PCs (left) and frequencies of IgE+ PCs (right) in the thymus and BM. C Recipient CD45.2/2 BALB/c mice were transplanted with thymic lobes of newborn CD45.1/1 mice underneath the kidney capsule and analyzed after 4 weeks. Representative dot plots show B220+CD19+ thymic B cells, and graph shows statistical comparison (N = 3). Numbers indicate frequencies of cells in adjacent gates. Data are presented as mean values ± SD (A, B, and C). Each dot represents an individual mouse. Unpaired two-tailed t-tests were used. ***p < 0.001, **p < 0.01, *p < 0.05. DP Double positive; Mat B Mature B cells; PC Plasma cell; Thy Thymus; Spl Spleen; BM Bone marrow.

