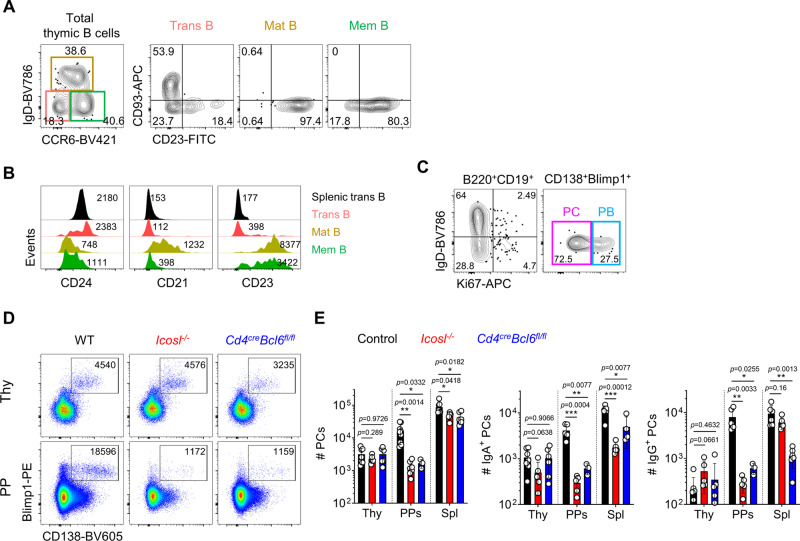
Fig. 5. Various stages of B cells develop in the thymus without GC reaction.
A Representative FACS plots show IgD−CCR6− transitional B, IgD+CCR6lo mature B, and IgD−CCR6hi memory B cells from total B220+CD19+ thymic B cells (left). Expression levels of CD93 and CD23 from indicated cells were shown (right three panels). Numbers indicate frequencies of cells in adjacent gates. B The histogram shows MFI of CD24, CD21, and CD23 expression from indicated cells. Numbers indicate MFI value. C Representative FACS plots show Ki67 expression in B220+CD19+ B cells (left) and CD138+Blimp1+ PCs (right) from total and CD138 enriched thymocytes, respectively. D, E Representative dot plots show PCs from CD138 enriched thymocytes (upper) and total cells in PPs (lower) from indicated mice (D). The number of cells was shown in adjacent gates. Results are from three independent experiments. Graphs show statistical analysis (N = 3–9 for each group) (E). Data are presented as mean values ± SD. Each dot represents an individual mouse. Unpaired two-tailed t-tests were used for comparison. ***p < 0.001, **p < 0.01, *p < 0.05. Not significant (p > 0.05). PB Plasmablast; PC Plasma cell; Thy Thymus; Spl Spleen; PPs Peyer’s patches; mLN Mesenteric lymph node; BM Bone marrow.

