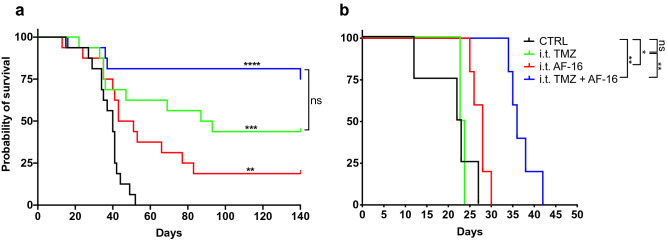
Figure 1.
The effect of intratumoral AF16 on survival. Kaplan–Meier survival curves for C57BL/6 (a) and NOD-Prkdcscid (b) mice orthotopically inoculated with the syngeneic murine glioblastoma cell line GL261 into the right hemisphere and later treated with AF16, TMZ, and AF16 + TMZ solutions in CED pumps. In (a), untreated C57BL/6 mice (black curve, n = 14) are compared with TMZ alone (green curve, n = 16, p < 0.001 ***), AF16 alone (red curve, n = 16, p < 0.01 **), and AF16 with TMZ (blue curve, n = 16, p < 0.0001 ****). TMZ alone compared to AF16 with TMZ showed p = 0.085. In (b), untreated NOD-Prkdcscid mice (black curve, n = 4) are compared with TMZ alone (green curve, n = 4, p = 0.774), AF16 alone (red curve, n = 5, p = 0.035 *) and AF16 with TMZ (blue curve, n = 5, p < 0.01 **). TMZ alone compared to AF16 with TMZ showed p < 0.01 **. All log rank tests.

