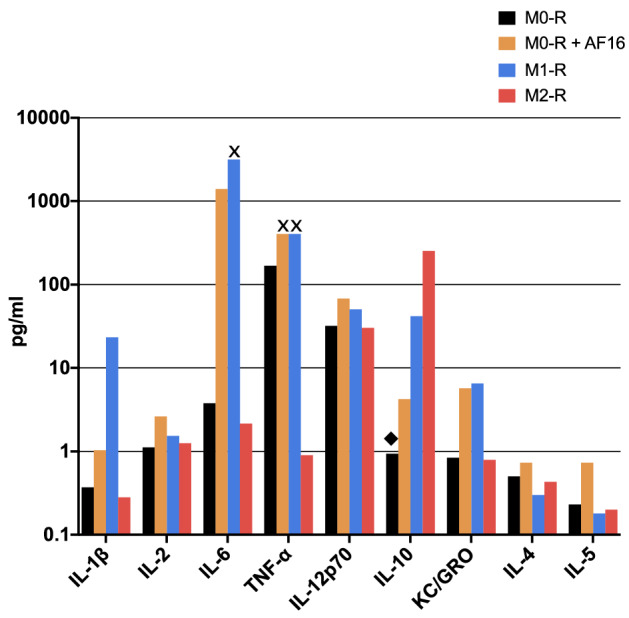
Figure 4.

Overview of inflammation-related cytokines upregulated by AF16 treatment of RAW264.7 cells (M0-R). AF16 treatment upregulated all shown factors. Values from untreated cells (black columns) are shown next to AF16-treated cells (orange columns), as well as M1 and M2 differentiated macrophages (blue and red columns, respectively). Values marked with ◆ and x indicate where the original values were replaced by the lowest limit of detection or upper limit of quantification, respectively. Values are shown in pg/ml on a logarithmic scale.
