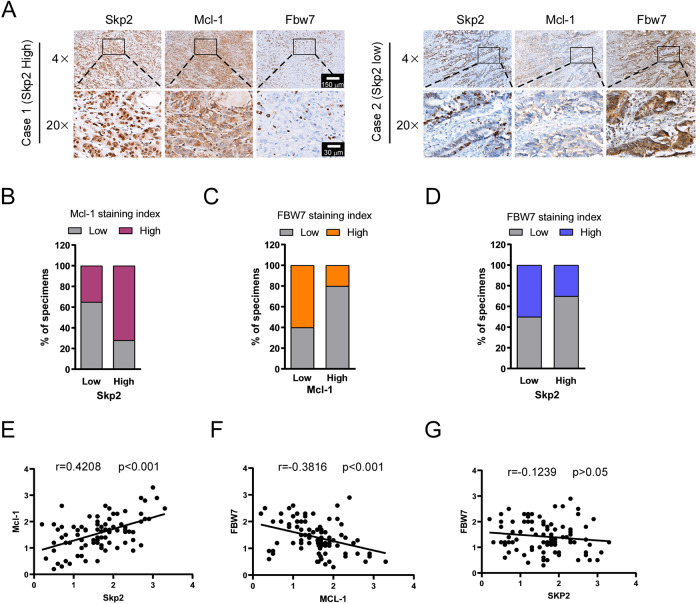
Fig. 7. Skp2 positively correlates with Mcl-1 in CRC tissues.
A representative cases from 87 CRC specimens were analyzed by IHC staining with Skp2, Mcl-1, and FBW7. B The percentage of samples displaying low or high Skp2 expression compared to the expression levels of Mcl-1. C The percentage of specimens displaying low or high Mcl-1 expression compared to the expression levels of FBW7. D The percentage of specimens displaying low or high Skp2 expression compared to the expression levels of FBW7. E Scatterplot showing the positive correlation between Skp2 and Mcl-1. F Scatterplot showing the negative correlation between Mcl-1 and FBW7. G Scatterplot showing no correlation between Skp2 and FBW7.

