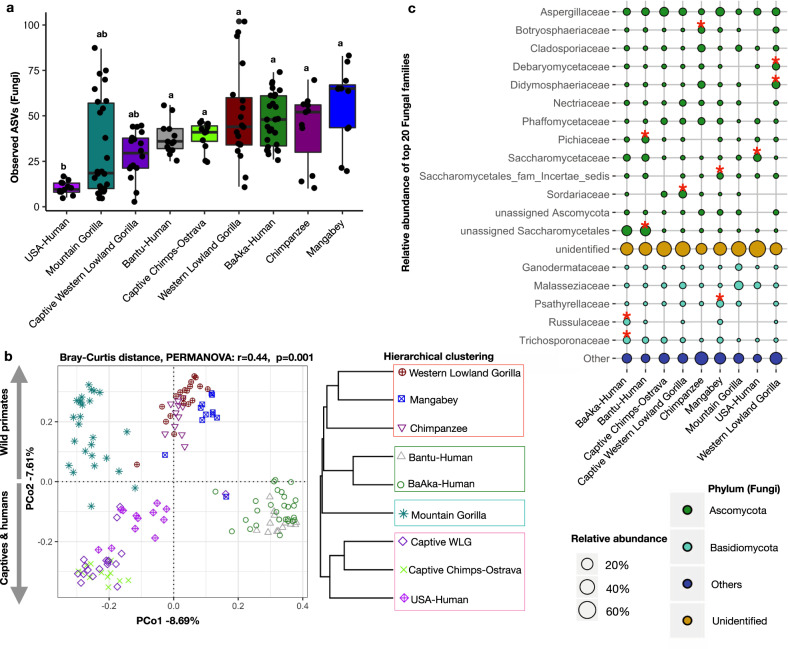
Fig. 1. Gut mycobiome composition differs based on subsistence strategy across different primates.
a Alpha diversity analysis showing lower fungal richness in US humans, compared with other primate populations. b Principal coordinate analysis based on Bray-Curtis distances showing different fungal community composition across different primate groups. Each symbol represents mycobiome composition, at the ASV level, in the fecal samples of an individual primate. A Bray-Curtis distance dendrogram (hierarchical clustering, average distances) based on average fungal ASV abundances showed similarities between phylogenetically distinct primate groups. Each group with similar mycobiome composition is shown to reflect PAM clustering (Supplementary Fig. 2). c Relative abundance of top 20 fungal families and their mean distribution among different primate groups are shown in a Bubble plot. Color code represents membership of each family to a specific Fungal Phylum. Differentially abundant taxa (Supplementary Table 1) were identified using Indicator Species Analysis and the families marked with stars are representative of a given primate group. The identifiers used for primate groups are Western Lowland Gorilla: WLG, Mangabey: Agile Mangabeys and Chimps: Chimpanzee. In boxplots, center values indicate the median; bounds of box represents lower/upper quartiles; whiskers show inner fences.

