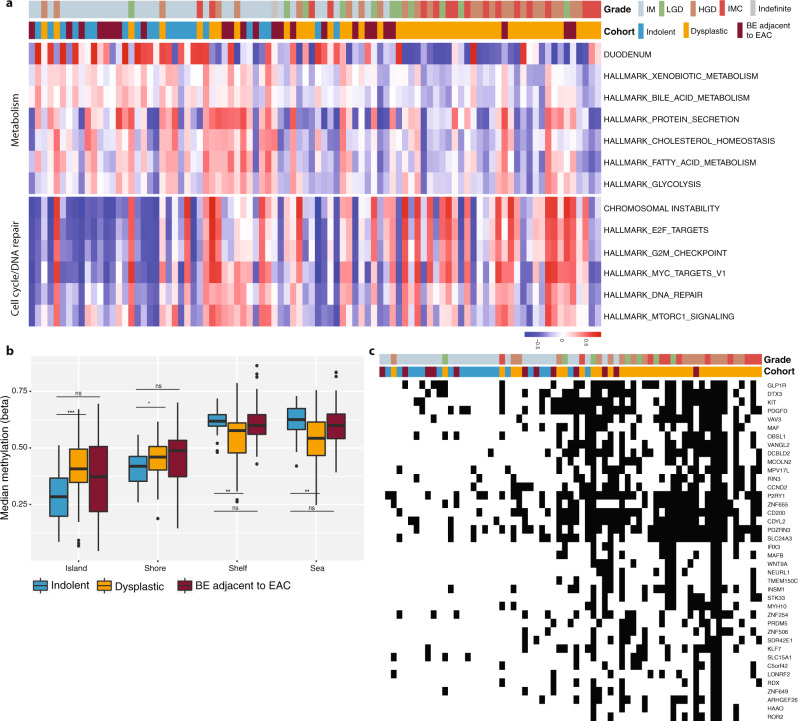
Fig. 4. Expression pathway and methylation analysis of the continuum.
a Gene set enrichment analysis revealed the differential enrichment of genes involved in two main pathways, along the continuum: metabolism and cell cycle/DNA repair. Samples are ordered based on the SV continuum in Fig. 2, with highest patient grade and cohort group denoted at the top. b Median methylation levels for the cohort groups within different regions of the genome in relation to the CpG islands: island, shore (up to 2 kb from CpG island), shelf (2–4 kb from CpG island) and sea (>4 kb from CpG island). N = 100. Boxplot centre line denotes median, box limits are upper and lower quartiles, whiskers denote 1.5* the interquartile range. Statistical significance was calculated using Wilcoxon signed-ranked test. ns non-significant, *p-value < 0.05, **p-value < 0.5, ***p-value < 0.001. c Integrated gene expression and methylation data. Patients are aligned along the same SV continuum order. Thirty-seven genes related to the Wnt signalling and cell cycle pathways for which altered expression followed a gain in promoter methylation and for which there was a significant change in expression with progression.

