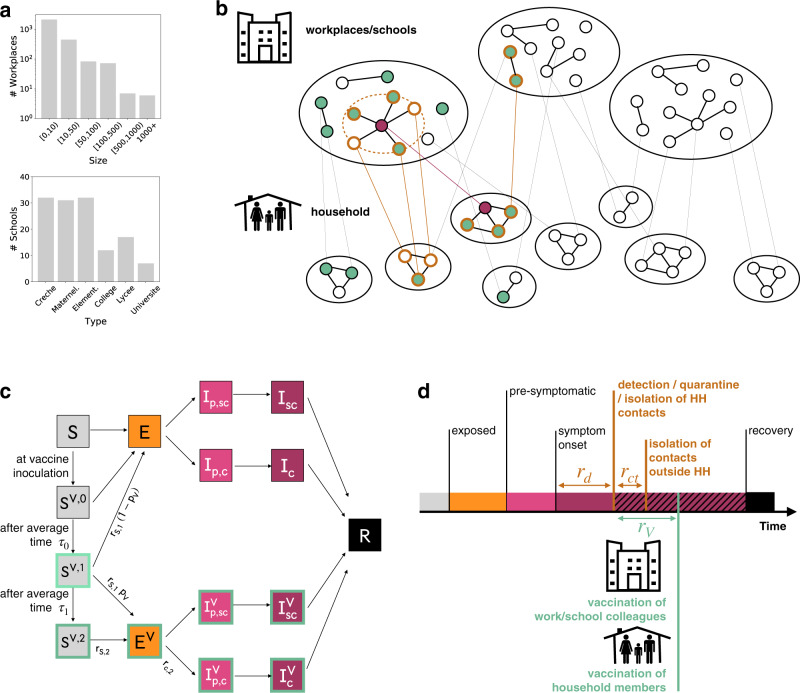
Fig. 1. Modelling reactive vaccination.
a Distribution of workplace size and of school type for the municipality of Metz (Grand Est region, France), used in the simulation study. b Schematic representation of the population structure, the reactive vaccination and contact tracing. The synthetic population is represented as a dynamic multi-layer network, where layers encode contacts in household, workplace, school, community and transport. In the figure, school and workplace layers are collapsed and community and transport are not displayed for the sake of visualisation. Nodes repeatedly appear on both the household and the workplace/school layer. The identification of an infectious individual (in purple in the figure) triggers the detection and isolation of his/her contacts (nodes with orange border) and the vaccination of individuals attending the same workplace/school and belonging to the same household who accept to be vaccinated (green). c Compartmental model of COVID-19 transmission and vaccination. Description of the compartments is reported on the Methods section. d Timeline of events following infection for a case that is detected in a scenario with reactive vaccination. For panels c, d transition rate parameters and their values are described in the Methods and in the Supplementary Information.

