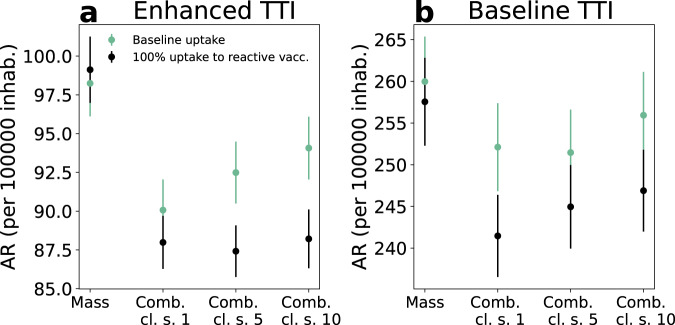
Fig. 4. Combined reactive and mass vaccination for managing a COVID-19 flare-up.
a, b Attack rate (AR) per 100,000 inhabitants in the first 2 months for the enhanced (a) and baseline (b) TTI scenarios described in the main text. Four vaccination strategies are compared: mass only, combined where the reactive vaccination starts at the detection of 1, 5, 10 cases (Comb. cl. s. = 1, 5, 10 in the Fig.). For mass vaccination the number of first-dose vaccinations during the period is the same as in the comb. cl. s = 1 of the same scenario. Except when otherwise indicated parameters are the ones of the baseline epidemic scenario with intermediate vaccination coverage at the beginning—i.e. R = 1.6; VES,1 = 48%, VESP,1 = 53%, VES,2 = 70%, VESP,2 = 73%; initial immunity 32%; vaccinated at the beginning 90% and 40% for 60+ and <60, respectively. In both panels, data are means over 8000 independent stochastic realisations and error bars are the standard error of the mean (±2SEM). Corresponding incidence curves are reported in Supplementary Fig. 9. The following abbreviations were used in the Fig.: vacc. for vaccines, inhab. for inhabitants.

