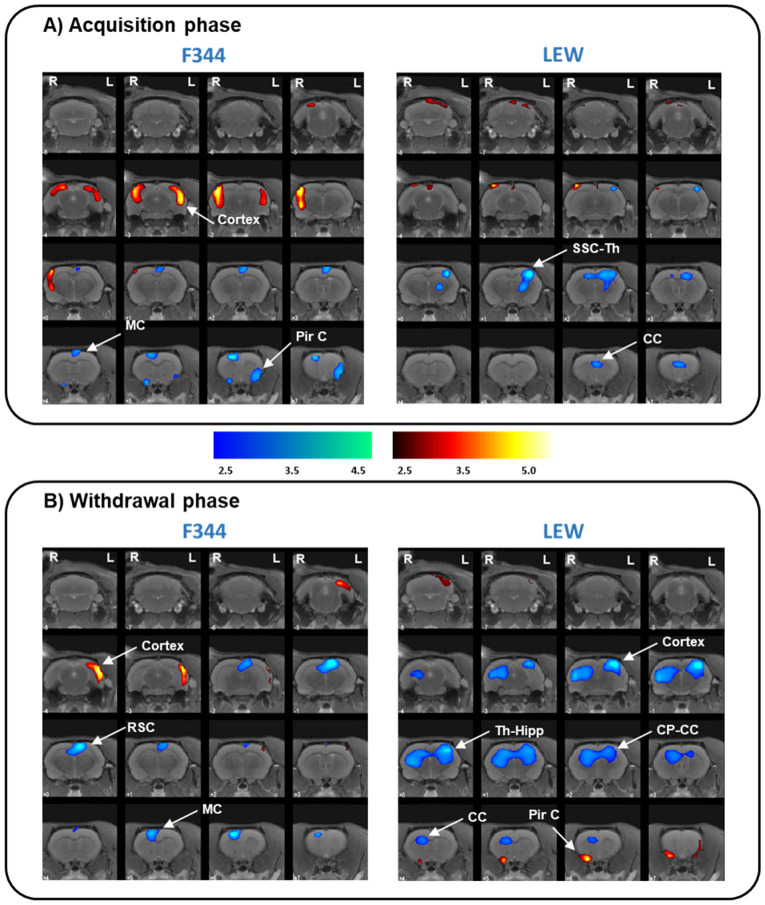
Figure 2.
Brain glucose metabolism patterns associated with morphine consumption in F344 and LEW rat strains. PET results in T-maps overlaid on a T2-MRI reference showing increased FDG uptake (hot colors) or decreased FDG uptake (cold colors). PET results in the F344-morphine (left) and LEW-morphine (right) animals compared to the Sal-F344 and Sal-LEW animals respectively, in the acquisition phase (A) and the withdrawal phase (B). (A) F344-morphine animals showed higher FDG uptake in the cortical area and lower FDG uptake in the motor and piriform cortex than the F344-saline animals. LEW-morphine animals showed lower FDG uptake in the somatosensorial and cingulate cortex and thalamus and higher FDG uptake in the cerebellum than the LEW-saline animals. (B) F344-morphine animals showed higher FDG uptake in the left cortex and lower FDG uptake in the restrosplenial and motor cortices than the F344-saline animals. LEW-morphine animals showed higher FDG uptake in the cerebellum and piriform cortex and lower FDG uptake in the cortex, thalamus, hippocampus, and caudate putamen than the LEW-saline animals. LEW-saline (n = 5), LEW-morphine (n = 6), F344-saline (n = 7), and F344-morphine (n = 6). Threshold for statistical significance of p < 0.01. Region of interest (C: cortex, CC: cingulate cortex, Cb: Cerebellum, CP: caudate putamen, Hipp: hippocampus, MC: motor cortex, PirC: piriform cortex, RSC: retrosplenial cortex, Sept: septum, SSC: somatosensorial cortex; Th: thalamus). Side: left (L) and right (R). k: cluster size, T: Student t. FDG uptake: increase (↑) and decrease (↓). p: p value (unc: uncorrected, FWE: family-wise error).

