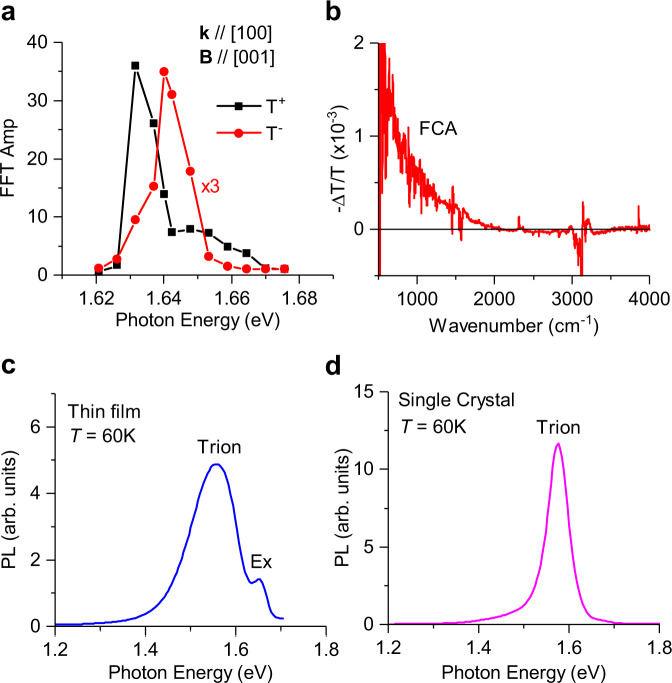
Fig. 6. The quantum-beating excitation spectra, photoinduced free carrier-absorption spectrum, and photoluminescence spectra.
a The quantum-beating FFT-amplitude spectra of the fast (T+) and slow (T−) oscillations, referred to as QB-excitation spectra, measured at B = 400 mT on (100) facet with applied B field along [001]. The QB-excitation spectra peak at 1.63 eV for the fast oscillations and 1.64 eV for the slow oscillations, both energies are below the exciton optical transition at 1.65 eV. b The photoinduced absorption (PA) spectrum of MAPbI3 thin film measured at 60 K using a FTIR spectrometer, excited at 470 nm, which shows free carrier-absorption (FCA) spectrum. c The PL-emission spectrum of a MAPbI3 thin film measured at 60 K that shows two bands: the higher-energy band ~1.65 eV is due to free exciton emission and the lower, broader band originates from trapped excitons in charged shallow traps (or trions). d The PL spectrum of a MAPbI3 single crystal measured at 60 K, which is predominantly due to trions.

