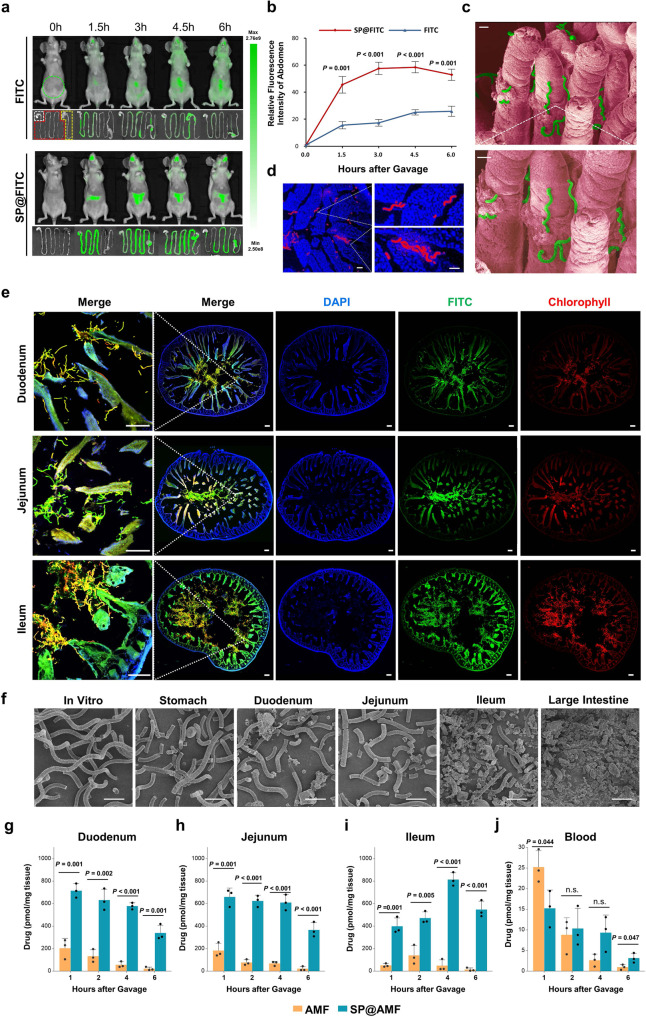
Fig. 3. Compared with free drug, SP-based system shows retention among villi, progressive degradation, and extensive drug distribution throughout the small intestine.
a Fluorescence images of the mice’s body and gastrointestinal tract at 0, 1.5, 3, 4.5, and 6 h after the oral administration of FITC or SP@FITC (with an equal amount of FITC). FITC channel: Ex, 445–490 nm; Em, 515–575 nm. The green dotted circle indicates the analyzed area for the fluorescence intensity quantification (b). White, red, and yellow dotted lines indicate the stomach, small intestine, and large intestine, respectively. b Quantification of the relative FITC fluorescence intensity in the abdominal area, shown by the ratios to the FITC intensity before gavage (n = 3 biologically independent animals). The data show means + SD. P between two groups was calculated using two-tailed t-test. c, d SEM (pseudo-color) (c) and fluorescence images (d) (blue, DAPI; red, chlorophyll) of the materials between the intestinal villi. Scale bar = 20 µm. e Fluorescence microscope images (blue, DAPI; green, FITC; red, chlorophyll) of SP@FITC in small intestines (duodenum, jejunum, and ileum) at 4 h after the oral administration of SP@FITC. Scale bar = 100 µm. Experiment was repeated three times independently with similar results. f SEM images of SP@FITC in the stomach, small intestines, and large intestines at 4 h after the oral administration of SP@FITC. Scale bar =25 µm. g–j The combined concentration of AMF and its active metabolite WR-1065 in intestinal tissue of duodenum (g), jejunum (h), ileum (i), and blood (j) at 1, 2, 4, and 6 h after AMF or SP@AMF treatment at the dose of 200 mg AMF/kg (n = 3 biologically independent animals). The data show means + SD. P was calculated using two-tailed t-test.

