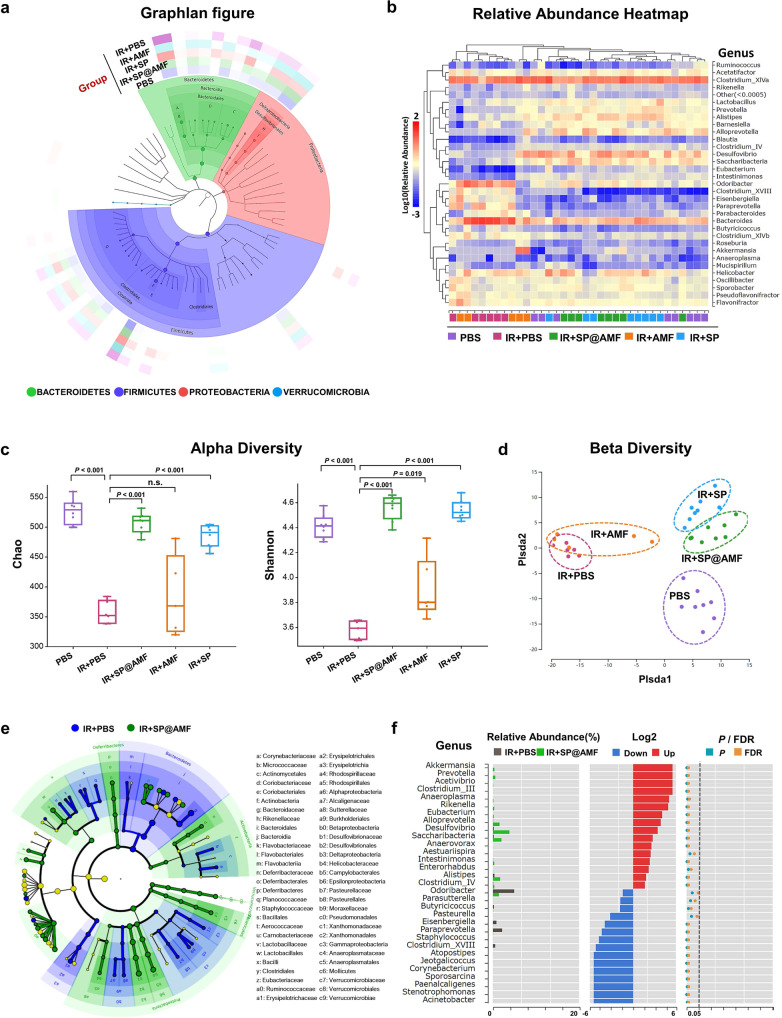
Fig. 8. 16S rRNA gene sequencing analysis shows the protective effect of SP@AMF on the gut microbiota of irradiated mice.
a Graphlan figure, depicting the taxonomic association between the microbiome communities from different groups. A Bacteroidaceae; B Bacteroides; C Porphyromonadaceae; D Prevotellaceae; E Lachnospiraceae; F Clostridium XlVa; G Ruminococcaceae; H Desulfovibrionaceae; I Desulfovibrio. b Relative abundance heatmap of the gut microbiota of the samples in different groups in genus level. c Alpha diversity boxplot, in which the index Chao represents the community richness, and the index Shannon represents the community diversity. n = 8 for PBS, IR + SP, and IR + SP@AMF; n = 6 for IR + PBS; n = 5 for IR + AMF (representing biologically independent animals). Results are presented as the boxes’ bounds (the 25th to 75th percentile) and lines representing maxima, medians, and minima. P was calculated using two-tailed t-test. d Beta diversity PLS-DA (partial least-squares discrimination analysis) figure, visualizing the differences in the microbiota composition between groups through the distance in x-coordinate and y-coordinate. e LEfSe taxonomic cladogram, depicting the taxonomic association between the microbiome communities from IR + PBS and IR + SP@AMF. f The analysis of significant differences of the microbiota between IR + PBS and IR + SP@AMF, based on the Wilcoxon rank-sum test. P was calculated using two-tailed t-test.

