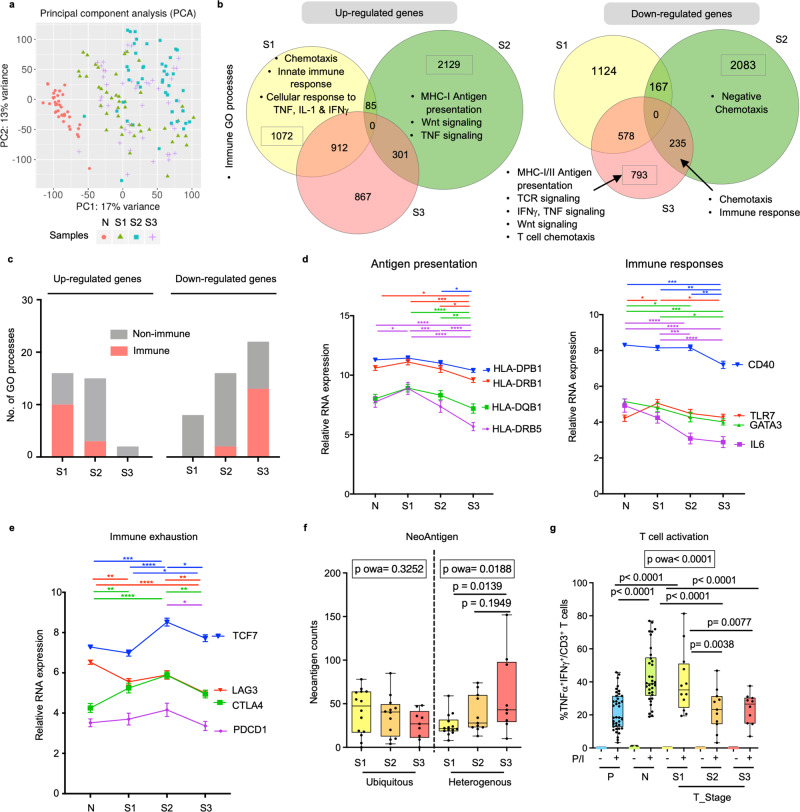
Fig. 4. Progressive tumour co-evolution along immune evasion at different HCC stages.
a Principal component analysis (PCA) of RNA sequencing profiles reveals sample distribution of HCC tumours from TNM stage I, II and III (S1, S2 and S3) and non-tumour tissues (N). b List of enriched immune-related Gene Ontology (GO) processes among tumours from three TMN stages. c Graphs compare the number of immune or non-immune related GO processes indicated by the upregulated or downregulated genes across different tumour stages (S1, S2 or S3). d Expression levels of genes involved in antigen-presentation (left) and immune responses (right) during tumour progression. e Expression levels of genes involved in immune exhaustion during tumour progression. d, e Two-way Anova test followed by respective unpaired Tukey’s pairwise comparison test colour coded by each gene; *, **, ***, **** denotes two-sided p-values <0.05, <0.01, <0.001 and <0.0001 respectively. Graphs show mean ± standard error of the mean. nN = 37, nS1 = 43, nS2 = 43 and nS3 = 45. f Changes of ubiquitous and heterogenous neoantigen counts across three tumour stages. nTS1 = 14, nTS2 = 12, nTS3 = 9. g Percentages of inflammatory TNFα+IFNγ+ active CD3+ T cells from peripheral blood (P) (n = 38), N (n = 34) and S1 (n = 12), S2 (n = 11) and S3 (n = 10) tumours (T_Stage), upon stimulation with PMA/Ionomycin (P/I) for 5 h. f, g Boxplots show median and the whiskers represent minimum and maximum values with the box edges showing the first and third quartiles. One-way ANOVA test (p owa) with two-sided p-values calculated by Tukey post-hoc multiple pairwise comparisons. Source data are provided as a Source Data file.

