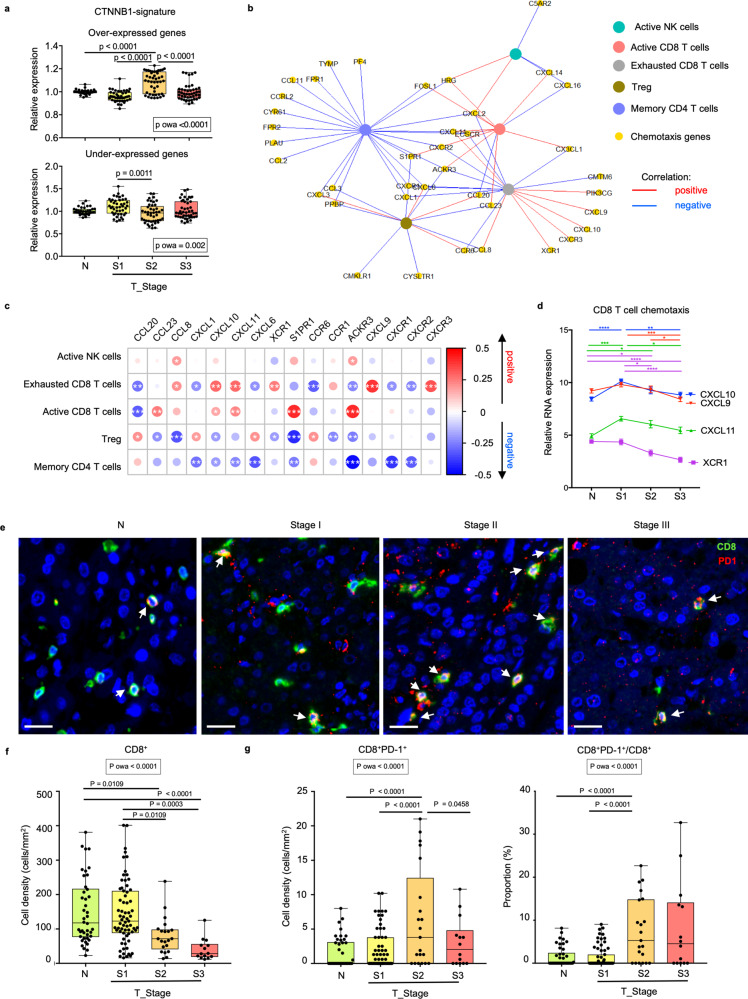
Fig. 5. Immune exclusion from stage II HCC.
a Expression levels of over-expressed (top) or under-expressed (bottom) genes in beta-catenin (CTNNB1) signature in adjacent non-tumour liver tissues (N) (nN = 37) and tumours from different stages (nS1 = 43, nS2 = 45 and nS3 = 45). b Chemokine genes (yellow circles) versus immune subsets (multiple colours circles) network showing positive (red lines) and negative (blue lines) correlations (Spearman’s correlation test, rho ≥ 0.2, P < 0.05). c Heatmap shows positive (red circles) and negative (blue circled) correlations between 16 selected chemotactic genes (columns) and five immune subsets (rows). Circle sizes represent Spearman’s rho; *, **, ***, **** denotes p-values < 0.05, <0.01, <0.001 and <0.0001 respectively. d Expression levels of genes involved in CD8 T cell related chemotaxis. Two-way ANOVA test followed by respective unpaired Tukey’s pairwise comparison test colour coded by each gene; *, **, ***, **** denotes two-sided p-values < 0.05, <0.01, <0.001 and <0.0001, respectively. Graph shows mean ± standard error of the mean. nN = 37, nS1 = 43, nS2 = 43 and nS3 = 45. e Representative immunohistochemistry (IHC) images of CD8 (green) and PD-1 (red), respectively in N and S1-S3 HCC tumours from an independent validation cohort. CD8+PD-1+ populations are indicated by white arrows. Bar = 20 um. f Boxplots compare densities of CD8+ T cells and g densities of CD8+PD-1+ T cells (left) as well as proportions of PD-1+CD8+/CD8+ T cells (right) by IHC in N and tumours from S1-S3 stages. f, g nN = 42, nS1 = 67, nS2 = 21 and nS3 = 14. a, f and g Boxplots show median and the whiskers represent minimum and maximum values with the box edges showing the first and third quartiles. One-way ANOVA test (p owa) with two-sided p-values calculated by Tukey post-hoc multiple pairwise comparisons. Source data are provided as a Source Data file.

