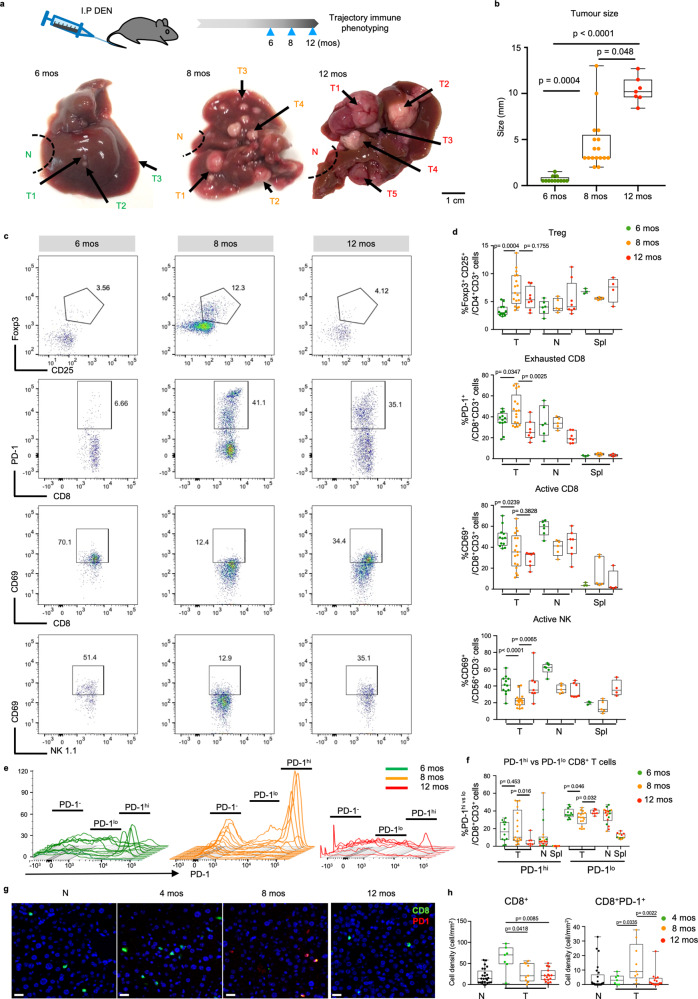
Fig. 6. Validation of immune evasion during tumour progression in murine HCC model.
a Representative images of murine livers bearing multiple tumours (T) from 6, 8 or 12 months (mos) after DEN-induction. Bar = 1 cm. b Tumours from 6, 8 or 12 mos after DEN-induction showing varying tumour size. c Representative dot plots of Foxp3+CD25+ Treg, PD-1+ exhausted CD8 T cells, CD69+PD-1− active CD8 T cells and CD69+NK1.1+ active NK cells in 6, 8 or 12 mos post-DEN tumours. d Comparison of frequencies (%) of Treg, exhausted CD8 T cells, active CD8 T cells and active NK cells in 6, 8 or 12 mos T, adjacent non-tumour liver tissues (N) and spleen (spl). e Histograms showing relative expression of PD-1 further distributed to PD-1hi, PD-1lo and PD-1− CD8+ T cell populations from 6 mos (green lines), 8 mos (orange lines) and 12 mos (red lines) post-DEN induced murine HCC tumours. f Graph showing percentages of PD-1hi and PD-1lo CD8+ T cell populations across 6, 8 or 12 mos post-DEN T, N and spl. g Representative immunohistochemistry (IHC) images of CD8 (green) and PD-1 (red), respectively in N and murine HCC tumours from 4, 8 or 12 mos post-DEN induction. Bar = 20 um. h Boxplots compare densities of CD8+ T cells and CD8+PD-1+ T cells by IHC in N (n = 25) or T from 4 (n = 7), 8 (n = 9) or 12 (n = 15) mos post-DEN induction. b, d, f and h Boxplots show median and the whiskers represent minimum and maximum values with the box edges showing the first and third quartiles. Non-parametric one-way ANOVA Kruskal–Wallis test with two-sided p-values calculated by Dunn’s post-test between groups. b, d and f graphs show data from nT6mos = 12, nT8mos = 17, nT12mos = 7, nN6mos = 6, nN8mos2 = 5, nN12mos = 7, nspl6mos = 3, nspl8mos = 5, nspl12mos = 4 post-DEN murine samples. Source data are provided as a Source Data file.

