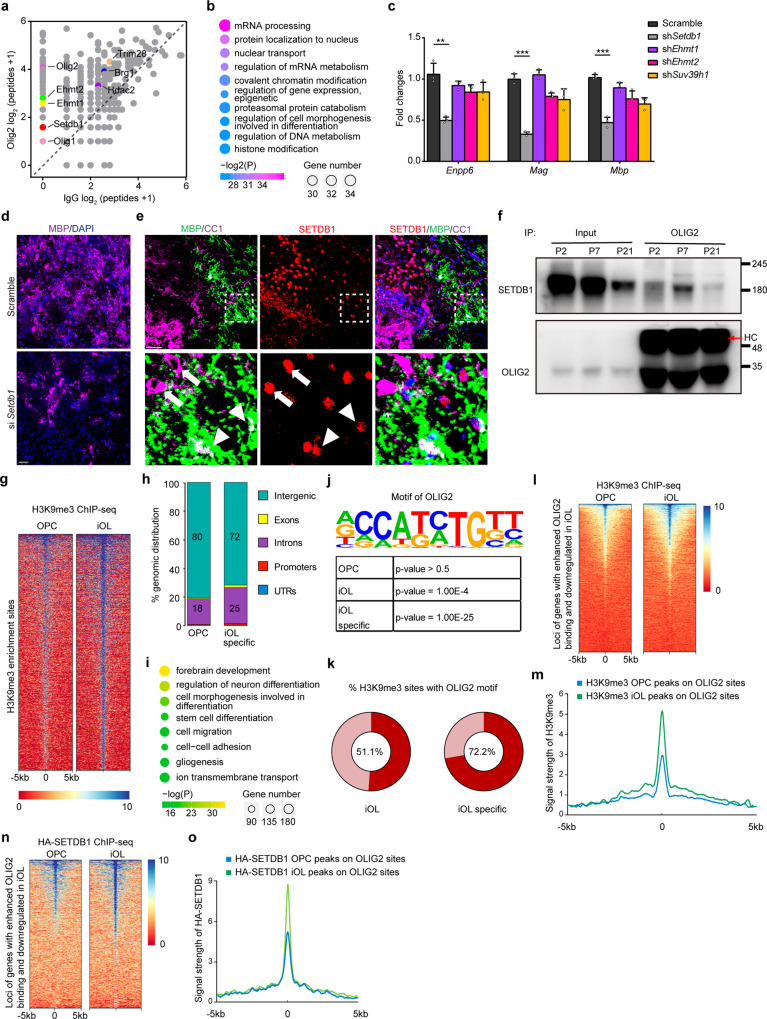
Fig. 2. OLIG2 assembles a repressor complex to dominant oligodendrocyte differentiation.
a Scatter plot of proteins bound to OLIG2. Enriched epigenetic associated protein especially H3K9m3 modifiers were highlighted. b Representative GO analysis of protein pulled down with OLIG2. c Expression of Enpp6, Mag and Mbp in rat OPCs transfected with indicated shRNA under differentiation condition. Error bars indicate SEM (Enpp6, p = 0.0031; Mag, p < 0.001; Mbp, p < 0.001. two-tailed unpaired Student’s t test). d Immunolabeling of MBP in rat OPCs transfected with indicated siRNA followed by differentiation-induction. n = 3 independent experiments. e Brain at P7 was immunostained with MBP, CC1 and SETDB1. Boxed areas in upper panels are shown at a high magnification in lower panels. Arrow indicates the co-expression of SETDB1 with CC1 but not MBP, and arrowhead indicates the co-expression of SETDB1 with CC1 and MBP. n = 3 different mice. f Co-immunoprecipitation (co-IP) of endogenous OLIG2 with SETDB1 in mouse cortex at P2, P7 and P21, respectively. HC heavy chain. n = 3 independent experiments. g Heatmap of H3K9me3- enrichment signals in rat OPCs and iOLs. h Genomic distribution of H3K9me3 enrichment regions in rat OPCs and specific in iOLs. i Representative GO analysis of genes nearest to iOL-specific H3K9me3 enrichment regions. j Binding motif identified by HOMER with H3K9me3- enrichment peaks. Letter size indicates nucleotide frequency at each position of OLIG2 binding motif. k The percentage of H3K9me3- enrichment peaks with OLIG2 binding motif in rat iOL. Heavy red color means the ratio. l, m Heatmap (l) and enrichment profiles (m) of H3K9me3- enrichment signals at rat OPCs and iOLs surrounding loci of genes which are downregulated and have enhanced OLIG2 binding upon differentiation. n, o Heatmap (n) and enrichment profiles (o) of HA-SETDB1- binding signals at rat OPCs and iOLs surrounding loci of genes which are downregulated and have enhanced OLIG2 binding upon differentiation. Scale bars: 50 μm in (d, e).

