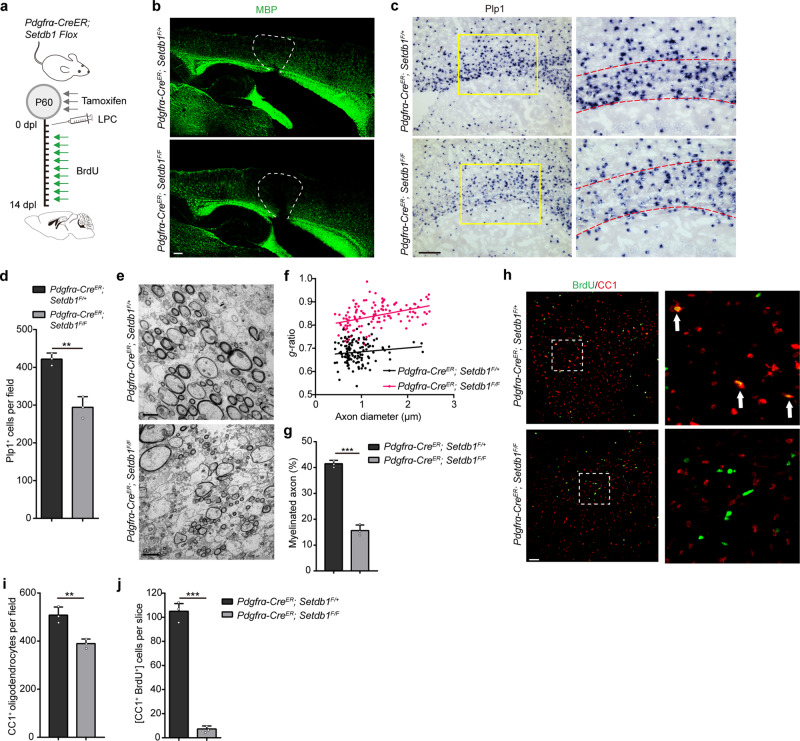
Fig. 4. SETDB1 is critical for proper myelin repair after demyelination.
a Schematic diagram showing tamoxifen administration to Pdgfra-CreER; Setdb1 Flox mice in 3 consecutive days at P60, followed by LPC injection and BrdU administration. Brain tissue were collected at 14 Dpl. b Immunolabeling of MBP in the LPC lesions of Pdgfra-CreER; Setdb1F/+ and Pdgfra-CreER; Setdb1F/F mice at 14 Dpl. n = 3 control and three mutant mice. c In situ hybridization of Plp1 in the lesions at 14 Dpl. Boxed areas in left panels are shown at a high magnification in corresponding right panels. n = 3 control and three mutant mice. d Quantification of Plp1+ cells in the LPC lesions. Error bars indicate SEM (p = 0.0023. two-tailed unpaired Student’s t test). e Electron micrographs in corpus callosum of lesions from Pdgfra-CreER; Setdb1F/+ and Pdgfra-CreER; Setdb1F/F mice at 14 Dpl. n = 3 control and three mutant mice. f Scatterplot of g-ratio at 14 Dpl in lesions area. g Percentage of remyelinated axons at 14 Dpl in lesions area. Error bars indicate SEM (p < 0.001. two-tailed unpaired Student’s t test). h Immunostaining for BrdU and CC1 in LPC lesions in corpus callosum from Pdgfra-CreER; Setdb1F/+ and Pdgfra-CreER; Setdb1F/F mice at 14 Dpl. Boxed areas in left panels are shown at a high magnification in corresponding right panels. n = 3 control and three mutant mice. i, j Quantification of CC1+ cells (i) and CC1+ /BrdU+ cells (j) in the LPC lesions area. Error bars indicate SEM (i, p = 0.0061; j, p < 0.001. two-tailed unpaired Student’s t test). Scale bars: 100 μm in (b, c); 2 μm in (e); 50 μm in (h).

