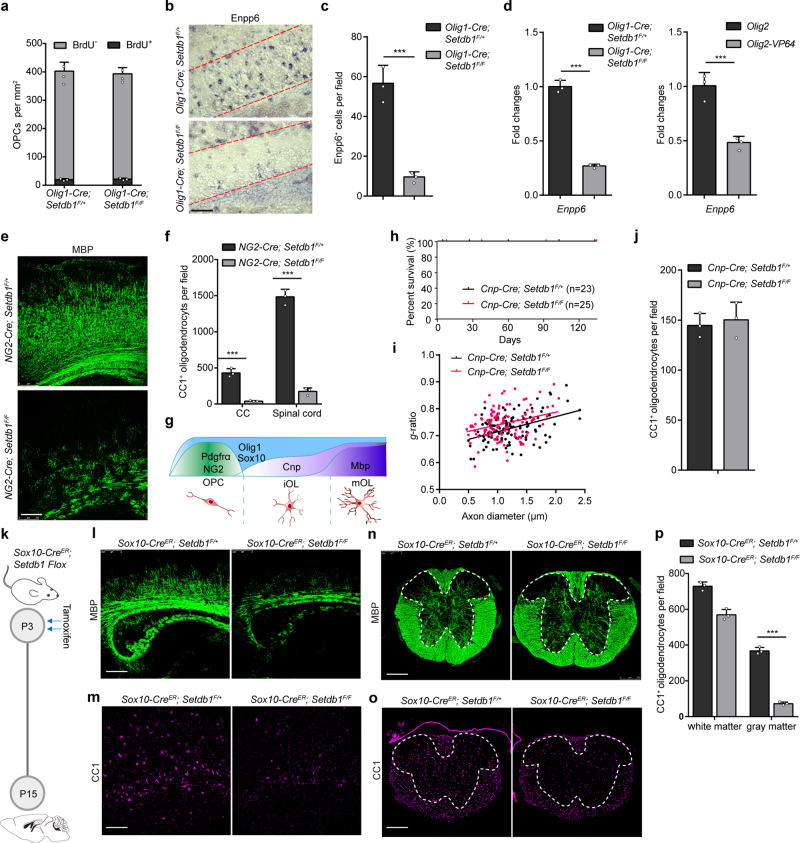
Fig. 5. OLIG2-SETDB1 repressor complex functions at the onset of mouse OPC differentiation.
a Quantification of BrdU+ and PDGFRα+ cells in the corpus callosum of Olig1-Cre; Setdb1F/+ and Olig1-Cre; Setdb1F/F mice at P14. b In situ hybridization of Enpp6+ in the corpus callosum at P14. n = 3 control and three mutant mice. c Quantification of Enpp6+ cells in the corpus callosum at P14. Error bars indicate SEM (p < 0.001. two-tailed unpaired Student’s t test). d Expression of Enpp6 in spinal cords of Setdb1 control and mutant mice (left panel) and rat iOLs transfected with Olig2 or Olig2-VP64 (right panel). Error bars indicate SEM (p < 0.001. two-tailed unpaired Student’s t test). e Immunostaining of MBP in the corpus callosum from NG2-Cre; Setdb1F/+ and NG2-Cre; Setdb1F/F mice at P14. n = 3 control and three mutant mice. f Quantification of CC1+ cell in the corpus callosum and spinal cord from NG2-Cre; Setdb1F/+ and NG2-Cre; Setdb1F/F mice at P14. Error bars indicate SEM (p < 0.001. two-tailed unpaired Student’s t test). g Schematic diagram showing markers of each stage in oligodendrocyte lineage. h Survival curve of Cnp-Cre; Setdb1F/+ and Cnp-Cre; Setdb1F/F mice. i Quantification of myelin sheath thickness (g-ratio) in optic nerves from Cnp-Cre; Setdb1F/+ and Cnp-Cre; Setdb1F/F mice at P14. n = 3 control and three mutant mice. j Quantification of CC1+ cells in the spinal cord of Cnp-Cre; Setdb1F/+ and Cnp-Cre; Setdb1F/F mice at P14. n = 3 control and three mutant mice. k Schematic diagram showing tamoxifen administration to Sox10-CreER; Setdb1 Flox mice in two consecutive days at P3, followed by tissue collection at P15. n = 3 control and three mutant mice. l–o Immunostaining of MBP and CC1 in the corpus callosum (l, m) and spinal cord (n, o) from Sox10-CreER; Setdb1F/+ and Sox10-CreER; Setdb1F/F mice at P14. n = 3 control and three mutant mice. p Quantification of CC1+ cells in the white matter or gray matter of spinal cord. Error bars indicate SEM (p < 0.001. two-tailed unpaired Student’s t test). Scale bars: 100 μm in (b); 250 μm in (e and l–o).

