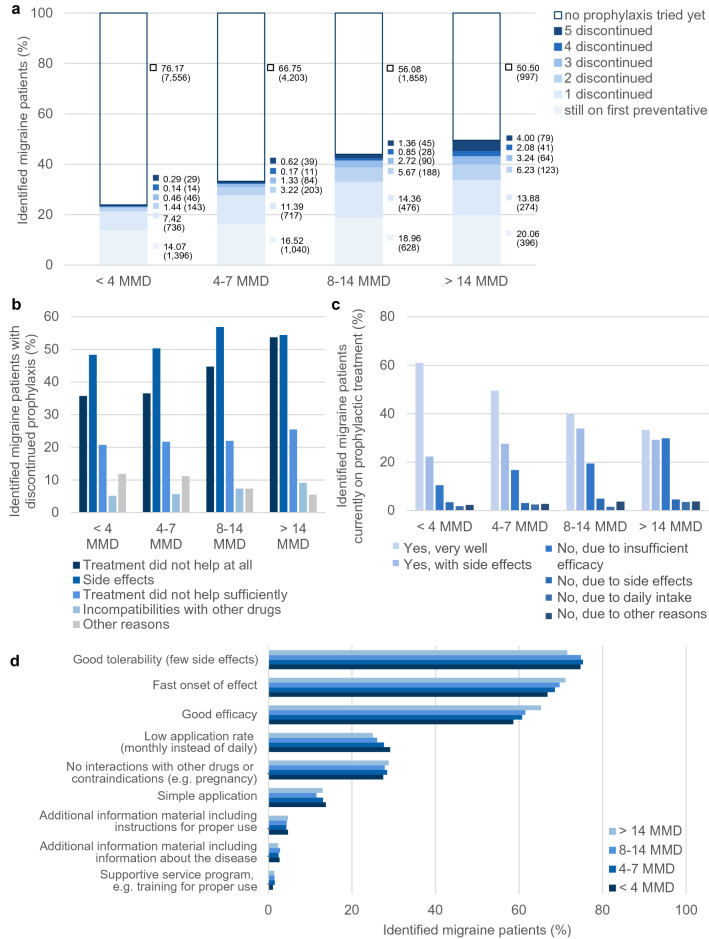
Figure 4.
Prophylactic treatments. (a) Graph shows the percentages of identified migraine patients that have tried 0–5 different prophylactic treatments depending on their MMD; respective percentages are depicted in the graph (absolute number of patients in brackets). (b) Shown are reasons for discontinuation of preventive treatments depending on the patients’ number of MMD. All patients who had previously discontinued at least one preventive treatment (N = 3430) were asked for their reasons (multiple reasons per patient were allowed). (c) Graph shows satisfaction of identified migraine patients with their current prophylaxis depending on the number of their MMD. (d) Depicted are the patients’ demands on a new prophylactic migraine treatment depending on their number of MMD.

