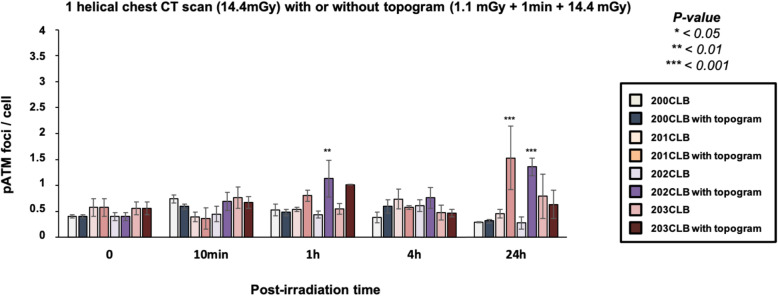
Fig. 6.
Kinetics of pATM foci in fibroblasts after a single helical chest computed tomography scan, with or without topogram. Kinetics of pATM foci at the indicated times after exposure (t0 = non-irradiated). The irradiation protocol corresponds either to a single dose of 14.4 mGy or to a dose of 1.1 mGy followed after 1 min, by 14.4 mGy. Data is shown as mean ± standard error of the mean of three independent experiments. Asterisks correspond to a statistically significant difference between conditions with or without topogram for the same cell lines (p < 0.050)

