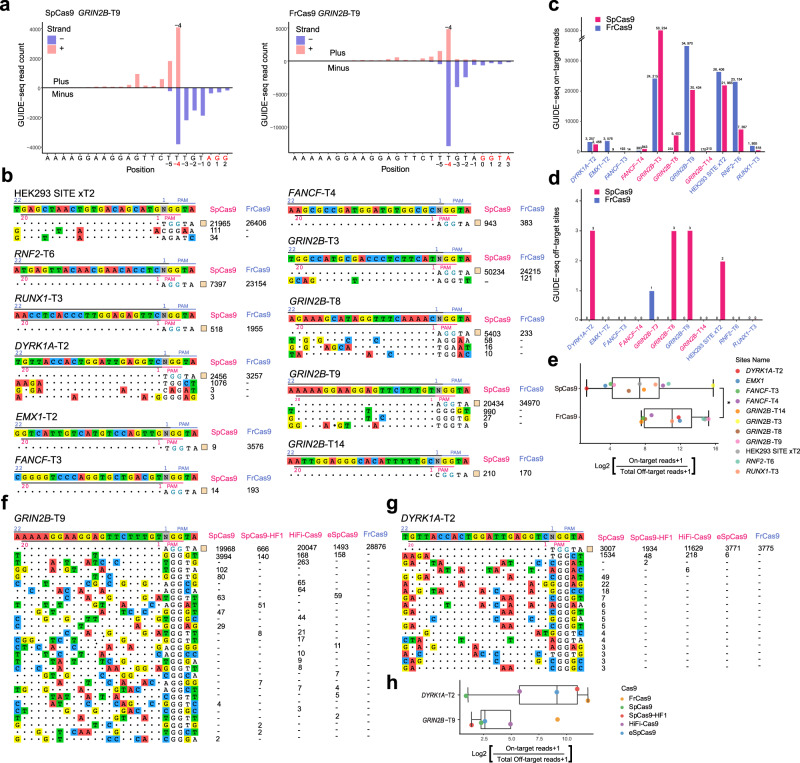
Fig. 3. The genome-wide specificities of FrCas9 and SpCas9.
a The start mapping positions of GUIDE-seq reads for SpCas9 and FrCas9 targeting GRIN2B-T9. The 1st bases of PAM sequences (red) were position 0 and the most frequent dsODN incorporation sites were colored in red. b The off-targets of SpCas9 and FrCas9 for 11 sites, generated by GUIDE-seq in HEK293T cells. The sgRNA and PAM ranges of SpCas9 (20 nt sgRNA and 3 nt PAM) and FrCas9 (22 nt sgRNA and 4 nt PAM) were marked. GUIDE-seq read counts of each site were shown on the right side. c Summary of GUIDE-seq on-target reads of SpCas9 and FrCas9 at the above 11 sites. d Summary of off-target counts of SpCas9 and FrCas9 at the above 11 sites. e The on:off ratio of GUIDE-seq reads. N = 11 sites. Box plots indicate median (middle line), 25th, 75th percentile (box) and 5th and 95th percentile (whiskers). P = 0.032, two-sided Student’s t-test, * representing P < 0.05. f, g The off-targets of FrCas9, SpCas9, SpCas9-HF1, HiFi-Cas9 and eSpCas9 in DYRK1A-T2 (f) and GRIN2B-T9 (g) detected by GUIDE-seq in HEK293T cell line. h The on:off ratio of FrCas9, SpCas9, SpCas9-HF1, HiFi-Cas9 and eSpCas9 in DYRK1A-T2 and GRIN2B-T9. N = 5 Cas9 nucleases. Box plots indicate median (middle line), 25th, 75th percentile (box) and 5th and 95th percentile (whiskers). The ratio is defined by GUIDE-seq on-target reads dividing total off-target reads. Source data are provided with this paper.

