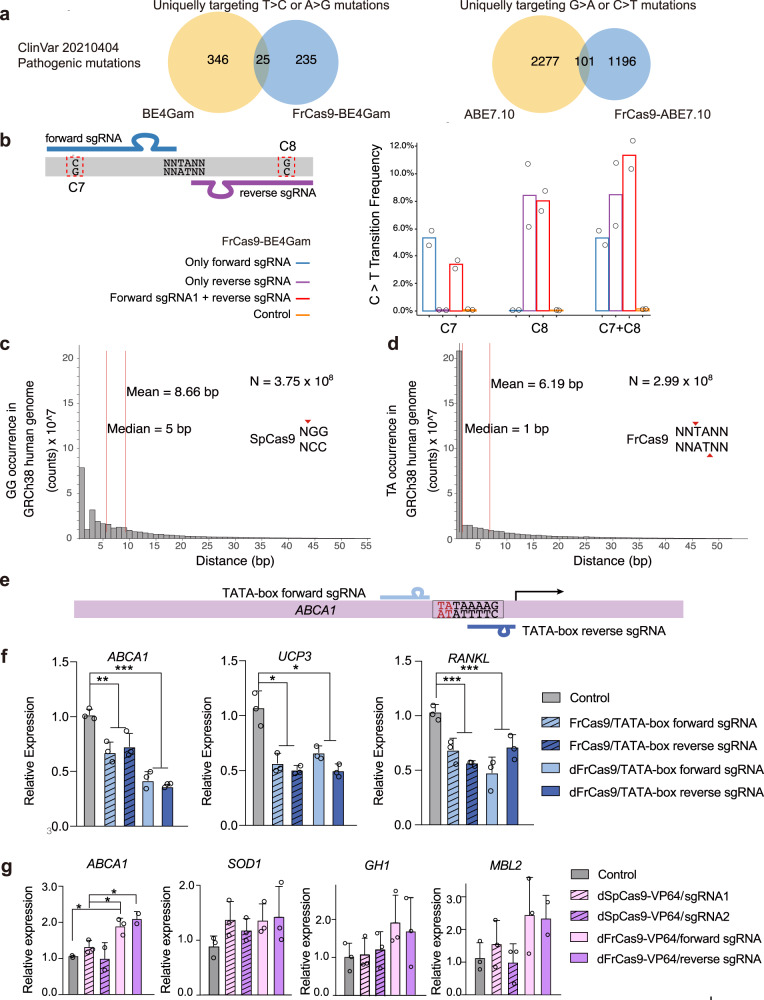
Fig. 5. The wide applications of FrCas9 due to its 5′-NNTA-3′ PAM.
a The veen diagram of pathogenic mutations in ClinVar database that could be corrected by SpCas9 and FrCas9 base editors. b The C > T transition efficiencies of FrCas9-BE4Gam using 2 “back-to-back” sgRNA at the same time. The efficiencies were assayed by amplicon sequencing (n = 2 biological independent replicates). c The 5′-GG-3′ (represented for SpCas9 PAM) and d The 5′-TA-3′ (represented for FrCas9 PAM) distribution in the GRCh38 human genome. e The schematics of FrCas9 targeting TATA-boxes of ABCA1 gene. CRISPRi f and CRISPRa g of FrCas9 and SpCas9 by targeting TATA-boxes. The experiments were conducted in HEK293T cells and expression was quantified by qPCR. Data are provided as mean value ± S.D (n = 3 biological independent replicates). The p values of Control vs. FrCas9/TATA-box sgRNAs on ABCA1, UCP3, and RANKL were 0.0010, 0.017, 0.00038, respectively. The p values of Control vs. dFrCas9/TATA-box sgRNAs on ABCA1, UCP3, and RANKL were 0.00024, 0.015, 0.00098, respectively. The p values of Control vs. dFrCas9-VP64 forward sgRNA, dSpCas9-VP64 sgRNA1 vs. dFrCas9-VP64 forward sgRNA and dSpCas9-VP64 sgRNA1 vs. dFrCas9-VP64 reverse sgRNA on ABCA1 were 0.021, 0.026, 0.042, respectively (*P < 0.05, **P < 0.01, ***P < 0.001, two-sided Student’s t-test). Source data are provided with this paper.

