
Figure 2.
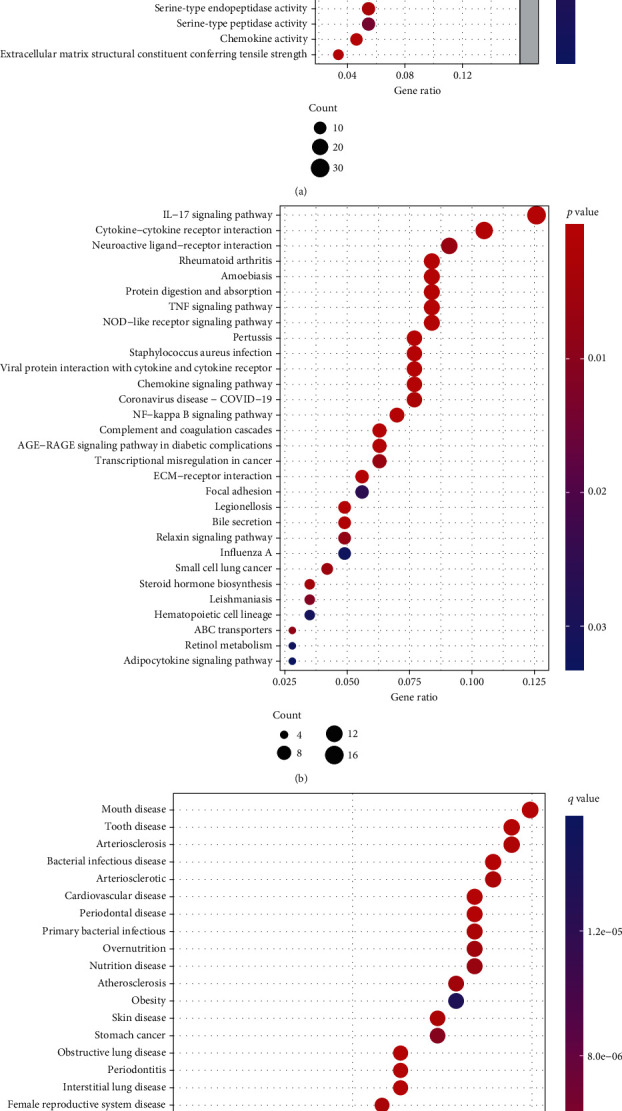
GO, KEGG, and DO analyses. (a) The bubble plot of enriched GO terms. (b) The bubble plot of the enriched KEGG pathways. (c) The bubble plot of the enriched DO pathways.
Official websites use .gov
A
.gov website belongs to an official
government organization in the United States.
Secure .gov websites use HTTPS
A lock (
) or https:// means you've safely
connected to the .gov website. Share sensitive
information only on official, secure websites.
GO, KEGG, and DO analyses. (a) The bubble plot of enriched GO terms. (b) The bubble plot of the enriched KEGG pathways. (c) The bubble plot of the enriched DO pathways.