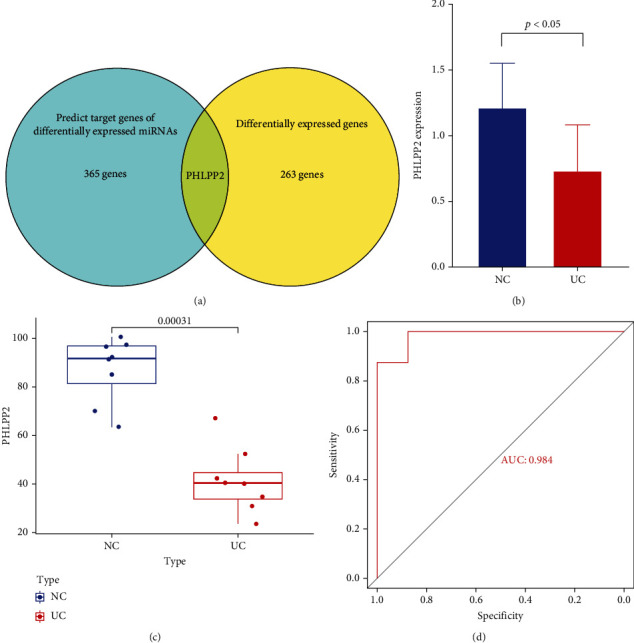
Figure 3.

Identification of the key genes. (a) Venn diagram showing the overlap between differentially expressed genes and predicted targets of the differentially expressed miRNAs. (b) The qPCR results revealed that PHLPP2 expression levels were significantly different between UC and healthy controls. (c) PHLPP2 expression in the primary chip data. (d) ROC curve for PHLPP2 in the primary chip data.
