Figure 2.
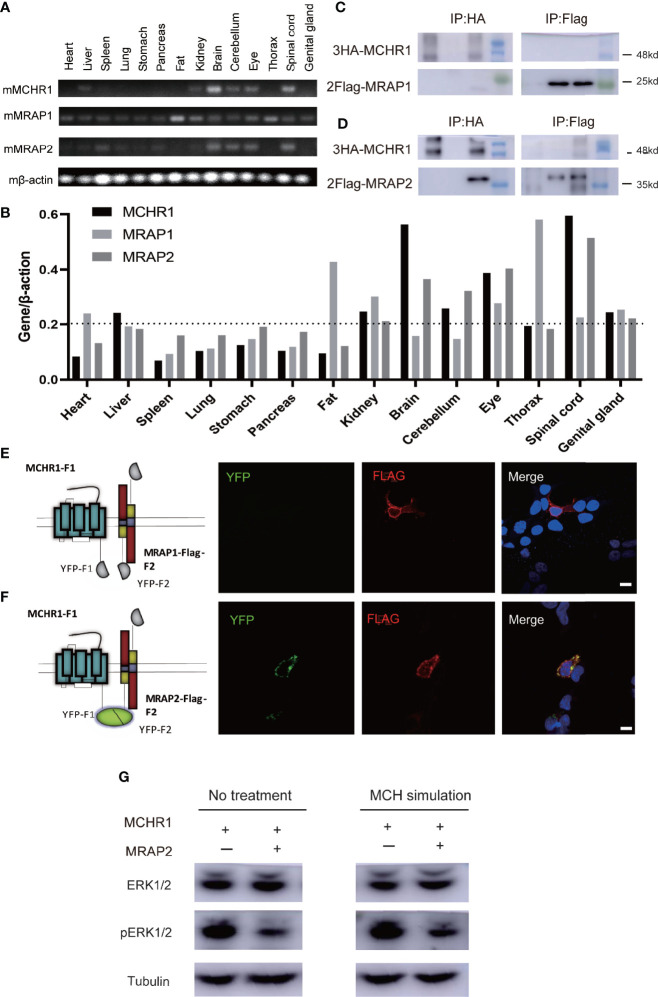
Protein interaction of MCHR1 with MRAP2 but not MRAP1. (A) Tissue distribution of MCHR1, MRAP1, and MRAP2 tested by RT-PCR. β-actin was used as an internal control. (B) Expression abundance analysis of MCHR1, MRAP1, and MRAP2 in 14 mouse tissues. (C, D) Co-IP analysis of the interaction between 3HA-MCHR1 and 2Flag-MRAP1 (C) or 2Flag-MRAP2 (D). The numbers on the right indicate molecular weight of marker band on the right (kd). (E, F) MCHR1-F1 co-localizes with MRAP1-Flag-F2 or MRAP2-Flag-F2 in live cells. YFP fluorescence is exhibited in green (left panel). MRAP1 or MRAP2 in the same cells detected with anti-Flag antibody and secondary anti-mouse Alexa594 is shown in red (middle panel). DAPI were applied to stain cell nuclei and shown in blue in merge figures (right panel) (scale bars, 10 μm). (G) Western blot for ERK1/2 and pERK1/2, and Tubulin is used as reference. The sample order: MCHR1, MCHR1+MRAP2, MCHR1 with MCH simulated, MCHR1+MRAP2 with MCH simulated (from left to right).

