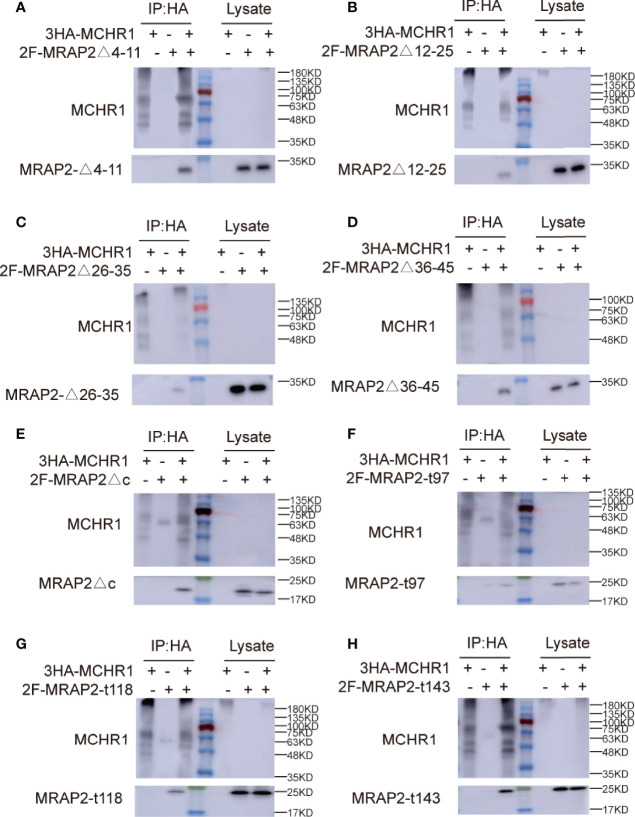
Figure 4.
Interaction between 3HA-MCHR1 and MRAP2 mutants. (A–D) The interaction between MCHR1 and MRAP2 C-terminal mutants. (E–H) The interaction between MCHR1 and MRAP2 N-terminal mutants. Middle lane with color is protein marker in all figures. The numbers on the right indicate molecular weight of marker band in the middle (kd).

