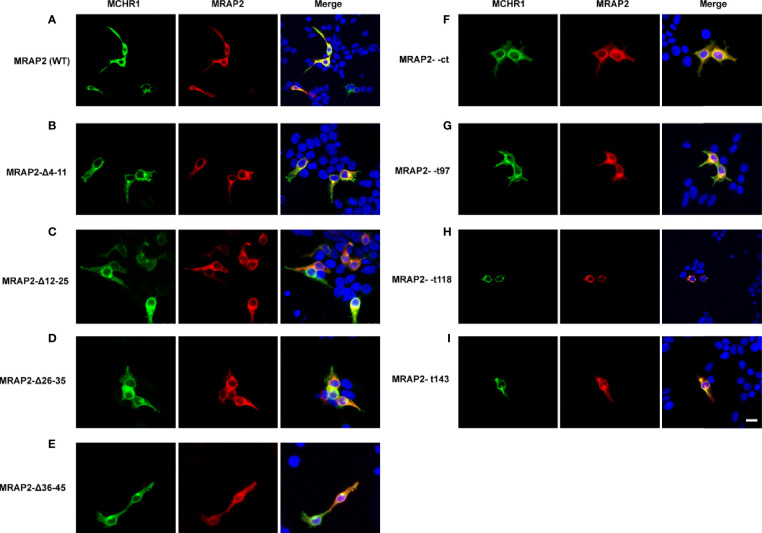
Figure 5.
Co-localization of MRAP2 mutants with MCHR1. (A) Confocal images of MCHR1 (green) when co-transfected with WTMRAP2 (red). (B–E) Localization of MCHR1 (green) when co-transfected with MRAP2 C-terminal mutants (red). (F–I) Images are co-transfected with MCHR1 (green) and MRAP2 N-terminal mutants. DAPI was used to stain cell nuclei and shown in blue. Merged images are shown in yellow.

