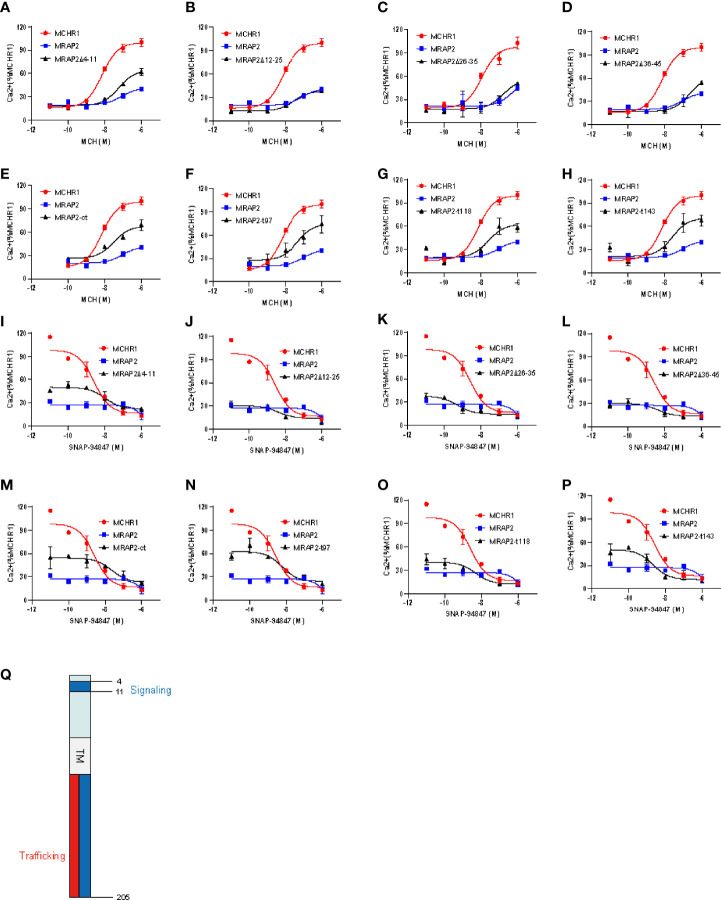
Figure 6.
The influence of MCHR1 signaling by the functional domains of MRAP2. (A–H) Calcium response of MCHR1 simulated by increasing concentrations of MCH, transfected with WT MRAP2 or indicated mutants. (I–P) Competition binding assay of MCHR1 in 293T cells transfected with wt MRAP2 or indicated mutants. Relative luminescence intensity of NFAT-luc represents the normalized NFAT-luc units to p-RL-TK units (transfected internal control). Each data point represents the mean ± SEM of three replicates (N = 3). (Q) Schematic diagram of distinct regions of MRAP2 required for regulating the trafficking and signaling of MCHR1.

