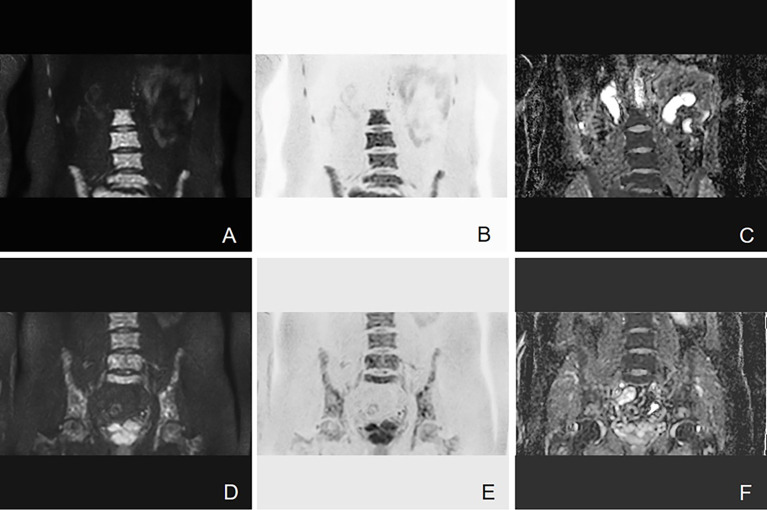
Figure 4.
Example of DW-MRI image with treatment response of SD. A case of a 52-year-old man who was diagnosed with MM (IgA kappa light chain, RISS Stage III) is presented here. (A–C) Coronal images of DWI, inverted images, and ADC map at baseline visit. (D–F) Corresponding images of the same patient after four courses of induction chemotherapy (three courses of bortezomib, cyclophosphamide, and dexamethasone + one course of bortezomib, ralidomide, and dexamethasone). The efficacy of induction chemotherapy was evaluated as SD. Diffuse abnormal signal can be seen in the lumbar spine and pelvis. It has been shown that the high signal in the bone marrow of DWI sequence slightly decreased after induction chemotherapy. The mean ADC value of lesions in the scan range also increased from 0.693 × 10⁻³ to 0.775 × 10⁻³ mm2/s.

