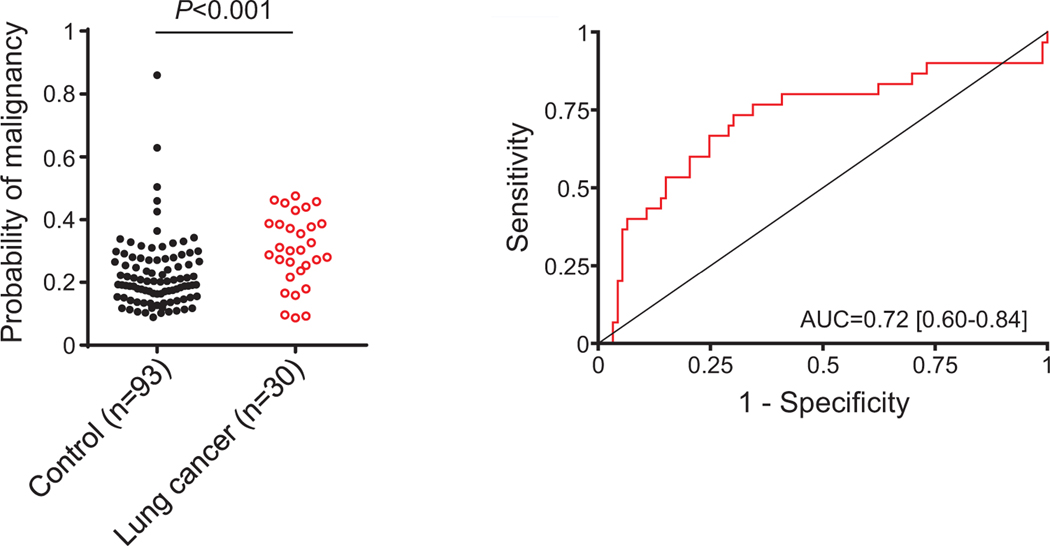
Fig 4.
Performance of the protein diagnostic model in the assessment of lung cancer risk in asymptomatic individuals. Probabilities of malignancy were calculated using the regression model generated from the quantification of C4c, CYFRA 21–1 and CRP in plasma samples from asymptomatic individuals who were or were not diagnosed with lung cancer in the context of a CT-screening program (n = 30 and n = 93, respectively). The ROC curve and the AUC obtained from these probabilities are also shown. The P value was calculated using the two-sided Mann-Whitney U test.

