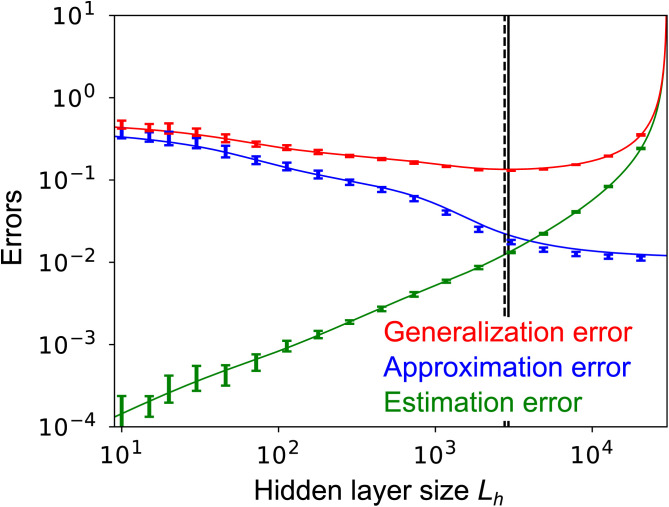
Fig. 3.
Generalization error (red; Eq. 12), approximation error (blue; Eq. 9), and estimation error (green; Eq. 11) at Lx = 50, , for various hidden-layer sizes Lh. Lines are analytical results; points are from numerical simulations (see SI Appendix, section 7.4 for details). Solid and dashed vertical lines are the minima of the generalization error from theory and simulations, respectively. Here, and in all figures except Fig. 4 D and E, both gt and gs are rectified linear functions []. In all figures except Fig. 6 we use for the noise in the teacher circuit, and in all figures the hidden-layer size of the teacher network is fixed at . Error bars represent the SD over 10 simulations.

