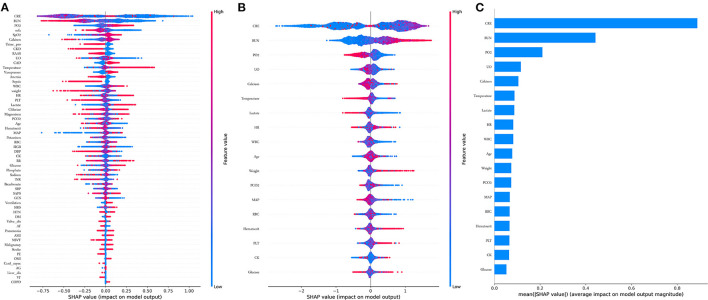
Figure 3.
Features importance estimated using the Shapley Additive explanations (SHAP) values. (A) All 58 features, the blue to red color represents the feature value (red high, blue low). The x-axis measures the impacts on the model output (right positive, left negative); (B) Compact 18 features; (C) Significance of the predictors in the LightGBM model. CRE, creatinine; BUN, blood urea nitrogen; PO2, partial pressure of oxygen; UO, urine output; HR, heat rate; WBC, white blood cell; PCO2, partial pressure of carbon dioxygen; MAP, mean aortic pressure. RBC, red blood cell; PLT, platelet; CK, creatine kinase.

