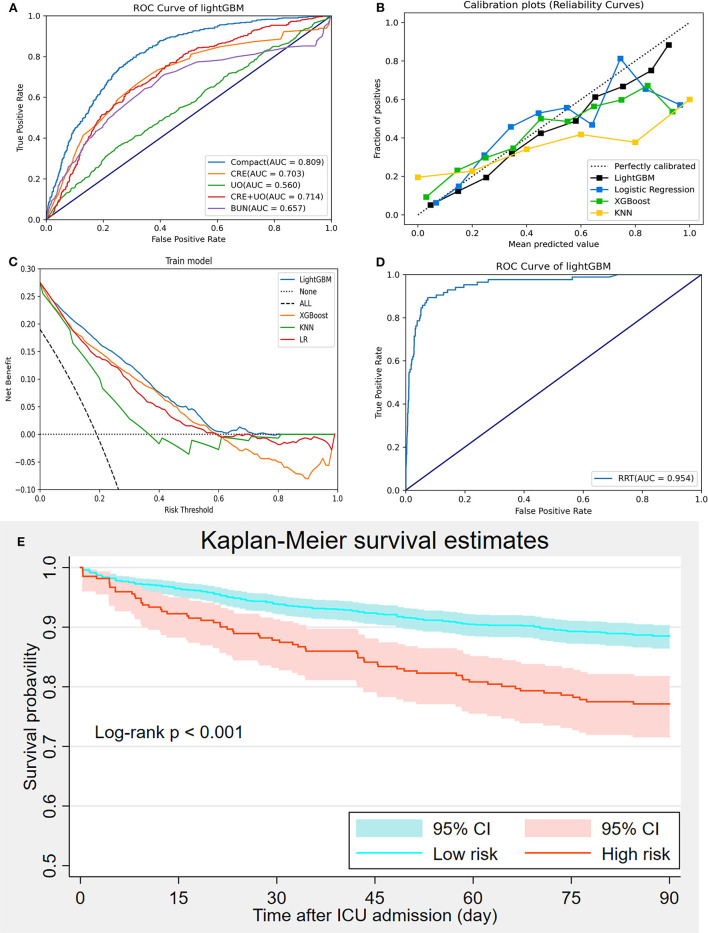
Figure 6.
Model evaluation and validation. (A) Comparisons of prediction performance between the compact model and measurements of creatinine, urine output, creatinine combined with urine output, and urea nitrogen; (B) Calibration curve; (C) Decision curve analysis; (D) Prediction of renal replacement therapy requirement using the LightGBM model; (E) Kaplan-Meier curve analysis of 90-day mortality between high-and low-risk groups divided using the LightGBM.

