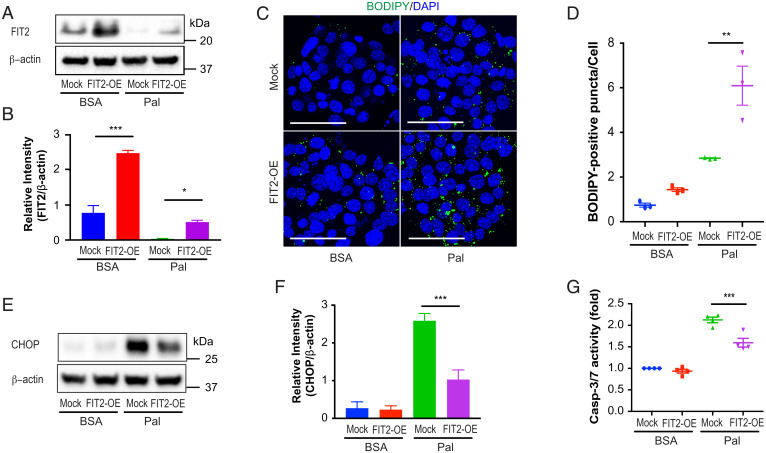
Fig. 4.
Overexpression of FIT2 in MIN6 cells ameliorates palmitate-induced lipotoxicity. (A–G) MIN6 cells were cultured in 6-well plates and transfected with 0.5 µg empty pcDNA3.1 vector (Mock) or pcDNA3.1-FIT2 (FIT2-OE) per well, followed by treatment with BSA or palmitate (300 µM) for 24 h. (A and B) Representative immunoblot and semiquantitation FIT2 protein levels (n = 3 independent experiments). (C) LD staining (BODIDY, green) in vector-transfected (Mock) or in FIT2-overexpressing (FIT2-OE) MIN6 cells (nuclei stained with DAPI; blue) in the absence (BSA) and presence of palmitate (300 µM, 24 h). Images shown are maximum intensity projections with a scale bar of 50 µm. (D) Quantitation of BODIPY-positive puncta per cell using Image J. (>1,000 cells from three independent experiments were analyzed per group). Representative immunoblot analysis (E) and corresponding semiquantitation of CHOP levels (n = 4) (F). (G) Measurements of capase-3/7 activity in control vector-transfected (Mock) or FIT2-overexpressing (FIT2-OE) MIN6 cells in the absence (BSA) or presence of palmitate (300 µM) (n = 4). Values shown are mean ± SEM; *P < 0.05; **P < 0.01; and ***P < 0.001 (two-way ANOVA with Šidák post hoc test).

