Fig. 3.
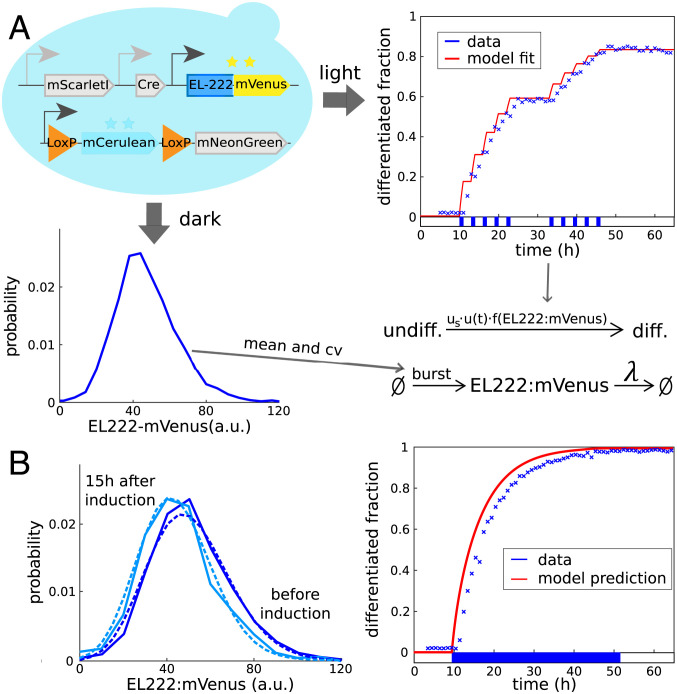
(A) Characterization of the differentiation system. (Bottom) Extracting mean (=50.6 arbitrary units [a.u.]) and coefficient of variation (=0.35) from measured stationary EL222:mVenus distributions before light induction allows one to determine burst frequency and average burst size of the EL222:mVenus production model up to a fluorescence scaling factor (SI Appendix, section S2). (Right) Exposing cell populations to light pulses and measuring dynamics of the resulting population composition (crosses indicate data, line indicates model fit, and applied light sequence is shown at the bottom) then allows one to determine parameters of the differentiation function (SI Appendix, section S2). (B) Dynamics in continuous light. (Right) Exposing cells to continuous light eventually leads to differentiation of the entire population. (Left) Cells that remain undifferentiated after light induction (light blue) seem to be characterized by slightly lower EL222:mVenus levels compared to initial levels (dark blue) according to both model predictions (dashed) and data (solid). Data from further time points are provided in SI Appendix, Fig. S2.

