Fig. 5.
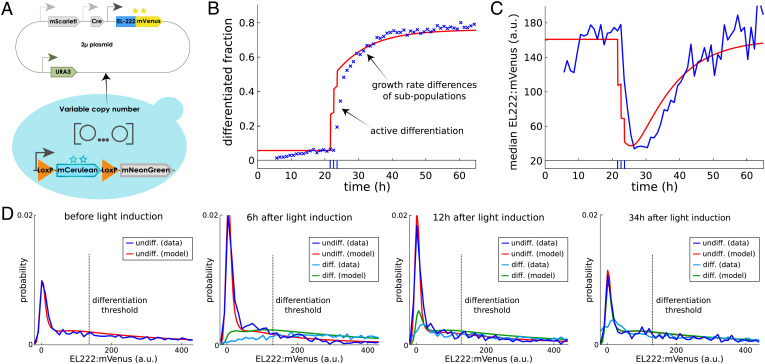
Prediction of emerging population dynamics for the plasmid-based differentiation system. (A) Sketch of the plasmid-based differentiation system. (B) Emerging dynamics of the differentiated fraction according to the composed model (red) for the same light input as in Fig. 2D are compared to experimental data (blue). According to the model, late increases in the differentiated fraction are due to varying subpopulation growth rates and not caused by active differentiation. (C) Upon light induction, median EL222:mVenus levels of undifferentiated cells drop fivefold to sixfold as predicted by the composed model. a.u., arbitrary units. (D) In the first panel, the model-predicted EL222:mVenus distribution in the dark agrees very well with experimental data even though these data were not used to parametrize the model. According to the model, the peak of the distribution close to zero corresponds to the of cells without plasmids (Fig. 4A). In the second and third panels, shortly after the application of light, cells with EL222:mVenus levels above the threshold parameter of the differentiation Hill function (dashed line) are enriched in the differentiated population while the undifferentiated population contains more cells without plasmids (increased peak close to zero). In the fourth panel, when cells are subsequently kept in the dark, EL222:mVenus distributions converge back to the initial condition. Model predictions show remarkable agreement with measured EL222:mVenus distribution dynamics, except for seemingly lower numbers of differentiated cells without plasmids in the data (in particular after 34 h). This small mismatch is presumably caused by inaccuracies in deconvolution (the presence of mNeonGreen in cells makes it difficult to precisely quantify low mVenus levels in cells; SI Appendix, section S9). Full time-varying distribution data of all fluorescent reporters for this experiment are displayed in SI Appendix, Fig. S8.

