Fig. 2.
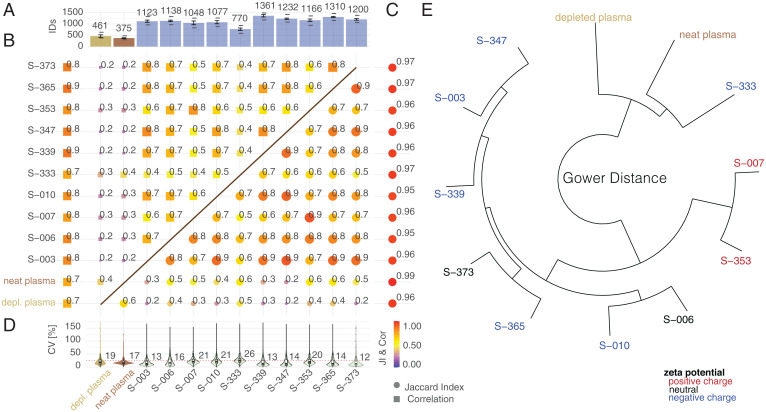
Interrogating the human plasma proteome with a multi-NP panel. (A) Median number of protein groups identified (1% protein, 1% peptide FDR for neat and depleted plasma, with the respective NPs shown as bar plots. Error bars denote SDs of protein IDs in assay replicates. The lower dash represents the number of identified proteins in three out of three assay replicates (complete features). The top dash depicts the number of proteins identified in any of the samples. (B) The top left triangular area shows the JI indicating degree of overlapping identifications as the mean JI across assay replicates (left column) and comparing individual NPs, depleted, and neat plasma (filtering for proteins quantified in three out of three assay replicates). Color and box size are scaled by the magnitude of JI. (C) The bottom right triangular area shows the Pearson correlation coefficient (r) indicating correlation of median normalized log10 intensities as the mean r across assay replicates (right column) and comparing individual NPs and neat plasma (filtering for proteins quantified in three out of three assay replicates, using median normalized intensity comparing pairwise common detections). Color and circle size are scaled by the magnitude of r. (D) Assay precision (CV) calculated for proteins quantified in three out of three assay replicates. Protein intensities were median normalized. Inner boxplots report the 25 (lower hinge), 50, and 75% quantiles (upper hinge). Whiskers indicate observations equal to or outside hinge ± 1.5 × interquartile range (IQR). Outliers (beyond 1.5 × IQR) are not plotted. Violin plots display all data points. (E) Gower distance mapped as distance tree for median protein intensities (filtered for three out of three identifications in assay replicates).

