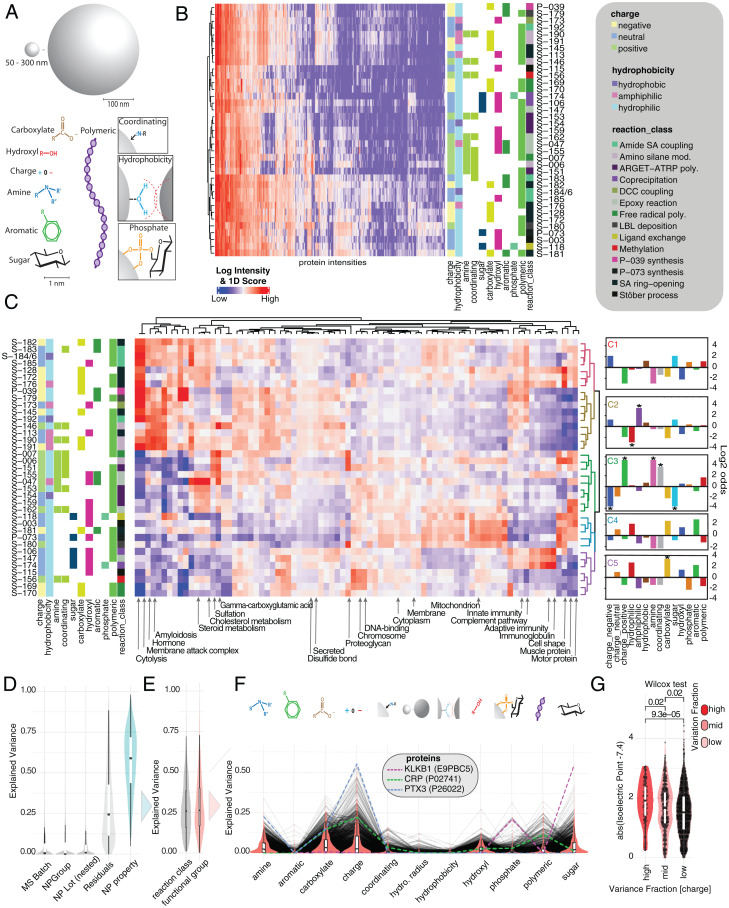
Fig. 3.
Effect of NP surface functionalization on protein corona composition. (A) NPs are classified based on a variety of physicochemical properties and functional groups including charge, polymer, sugar, aromatic systems, phosphates, amines, hydrophobicity, hydroxyl groups, coordinating property, and initial reaction class. (B) Unsupervised hierarchical clustering of median-normalized log10 protein intensities (1% FDR on protein and peptide level). Assay replicates of NP classes are median averaged. Missing values were filtered and imputed according to Materials and Methods. (C) The 1D annotation enrichment scores (heat map color ramp) for NPs. The 1D score was calculated for UniProt keywords as described in Materials and Methods. Enriched annotations are indicated in red; depleted annotations are indicated in blue. NPs are clustered based on the 1D score distributions. The log2–odds ratios of the NPs characteristic for each cluster are depicted as fingerprint diagrams on the right, with starred results indicating significance (P < 0.05) in Fisher’s exact test. (D) Variance decomposition analysis modeling normalized protein intensities as a function of NP’s physicochemical makeup (A). Explained variance by each variable was estimated using a linear mixed effects model and variancePartition package in R. The explained variance in protein intensities across NPs and the unexplained variance (residuals) are depicted as a density distribution. Variances explained for each protein across NP’s reaction class and functional groups are summed (turquoise distribution). (E) NP specific variance broken down into reaction class and functional groups. (F) Functional groups broken down into contribution of individual physicochemical properties. (G) Explained variance for functional group “charge” split into high (explained variance >30%), middle (explained variance <25 and >10%), and low (explained variance <10%). Wilcox test was used to determine P values. y axis depicts the absolute of predicted isoelectric point of each protein – 7.4 (pH of the assay). The larger that value, the more likely the protein has a net charge in the assay and can be affected by NP charge. Inner boxplots report 25 (lower hinge), 50, and 75% quantiles (upper hinge). Whiskers indicate observations equal to or outside hinge ± 1.5 × IQR. Outliers (beyond 1.5 × IQR) are not plotted. Violin plots capture all data points.

