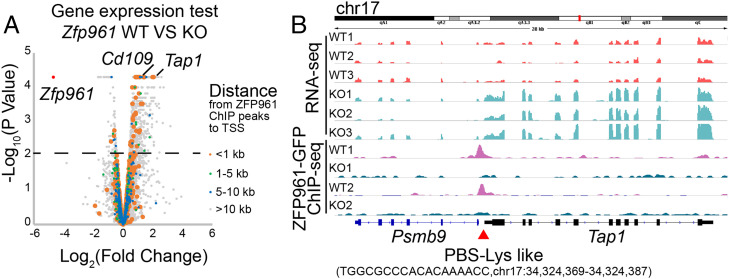
Fig. 2.
ZPF961 directly targets PBS-Lys for transcriptional repression. (A) Volcano plot of gene expression in Zfp961 KO mESCs compared with WT mESCs. The colored dots represent genes at different distances from their TSS to ZFP961 peaks. (B) Tracks of RNA-seq and ZFP961-GFP ChIP-seq signals in Zfp961 KO or WT mESCs at the Tap1 locus.

